

Real-time seroprevalence and exposure levels of emerging pathogens in infection-naive host populations
- PMID: 33712648
- PMCID: PMC7954847
- DOI: 10.1038/s41598-021-84672-1
Real-time seroprevalence and exposure levels of emerging pathogens in infection-naive host populations
Abstract
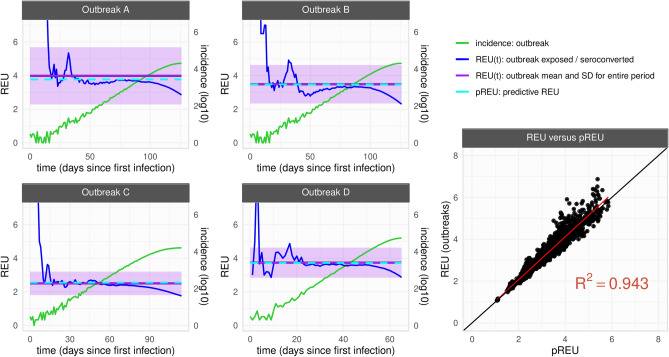
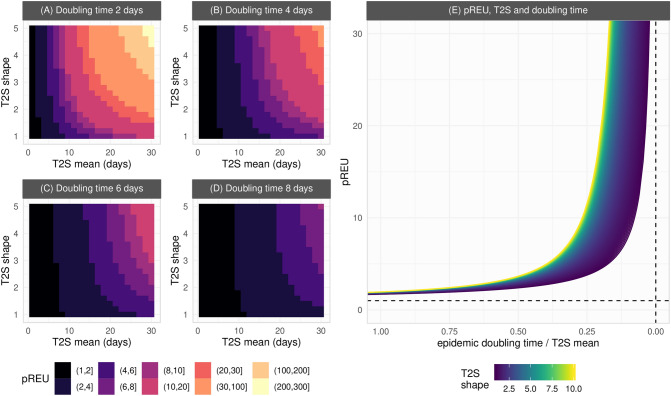
For endemic pathogens, seroprevalence mimics overall exposure and is minimally influenced by the time that recent infections take to seroconvert. Simulating spatially-explicit and stochastic outbreaks, we set out to explore how, for emerging pathogens, the mix of exponential growth in infection events and a constant rate for seroconversion events could lead to real-time significant differences in the total numbers of exposed versus seropositive. We find that real-time seroprevalence of an emerging pathogen can underestimate exposure depending on measurement time, epidemic doubling time, duration and natural variation in the time to seroconversion among hosts. We formalise mathematically how underestimation increases non-linearly as the host's time to seroconversion is ever longer than the pathogen's doubling time, and how more variable time to seroconversion among hosts results in lower underestimation. In practice, assuming that real-time seroprevalence reflects the true exposure to emerging pathogens risks overestimating measures of public health importance (e.g. infection fatality ratio) as well as the epidemic size of future waves. These results contribute to a better understanding and interpretation of real-time serological data collected during the emergence of pathogens in infection-naive host populations.
Conflict of interest statement
The authors declare no competing interests.
Figures

Similar articles
-
Patterns and processes of pathogen exposure in gray wolves across North America.Sci Rep. 2021 Feb 12;11(1):3722. doi: 10.1038/s41598-021-81192-w. Sci Rep. 2021. PMID: 33580121 Free PMC article.
-
Longitudinal assessment of SARS-CoV-2 IgG seroconversionamong front-line healthcare workers during the first wave of the Covid-19 pandemic at a tertiary-care hospital in Chile.BMC Infect Dis. 2021 May 26;21(1):478. doi: 10.1186/s12879-021-06208-2. BMC Infect Dis. 2021. PMID: 34039287 Free PMC article.
-
Dengue Seroprevalence and Seroconversion in Urban and Rural Populations in Northeastern Thailand and Southern Laos.Int J Environ Res Public Health. 2020 Dec 7;17(23):9134. doi: 10.3390/ijerph17239134. Int J Environ Res Public Health. 2020. PMID: 33297445 Free PMC article.
-
Microbial agents associated with waterborne diseases.Crit Rev Microbiol. 2002;28(4):371-409. doi: 10.1080/1040-840291046768. Crit Rev Microbiol. 2002. PMID: 12546197 Review.
-
Serological Evidence of Human Infection With Avian Influenza A(H7N9) Virus: A Systematic Review and Meta-analysis.J Infect Dis. 2022 Aug 12;226(1):70-82. doi: 10.1093/infdis/jiaa679. J Infect Dis. 2022. PMID: 33119755 Free PMC article.
Cited by
-
SARS-CoV-2 antibody prevalence in a pediatric cohort of unvaccinated children in Mérida, Yucatán, México.PLOS Glob Public Health. 2022 Jun 15;2(6):e0000354. doi: 10.1371/journal.pgph.0000354. eCollection 2022. PLOS Glob Public Health. 2022. PMID: 36962356 Free PMC article.
-
Asymmetric Mach-Zehnder Interferometric Biosensing for Quantitative and Sensitive Multiplex Detection of Anti-SARS-CoV-2 Antibodies in Human Plasma.Biosensors (Basel). 2022 Jul 22;12(8):553. doi: 10.3390/bios12080553. Biosensors (Basel). 2022. PMID: 35892450 Free PMC article.
References
Publication types
MeSH terms
Grants and funding
LinkOut - more resources
Full Text Sources
Other Literature Sources
