. 2021 Sep;15(9):2509-2522.
doi: 10.1038/s41396-021-00915-z. Epub 2021 Mar 12.

Small phytoplankton contribute greatly to CO2-fixation after the diatom bloom in the Southern Ocean

Affiliations

Small phytoplankton contribute greatly to CO2-fixation after the diatom bloom in the Southern Ocean

Solène Irion et al. ISME J. 2021 Sep.

Abstract

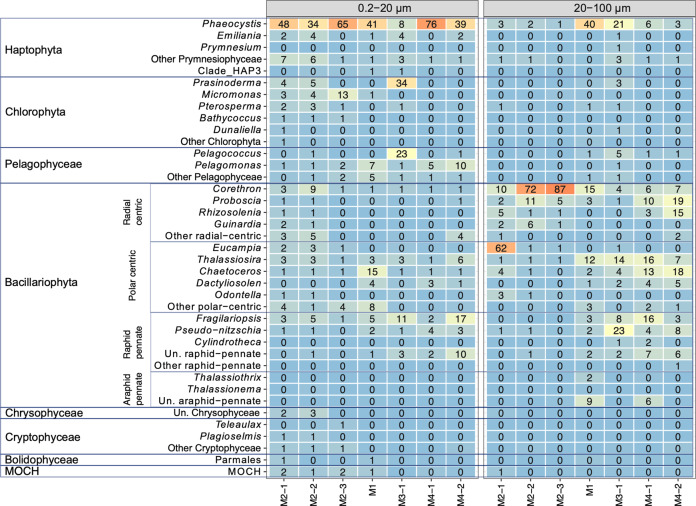
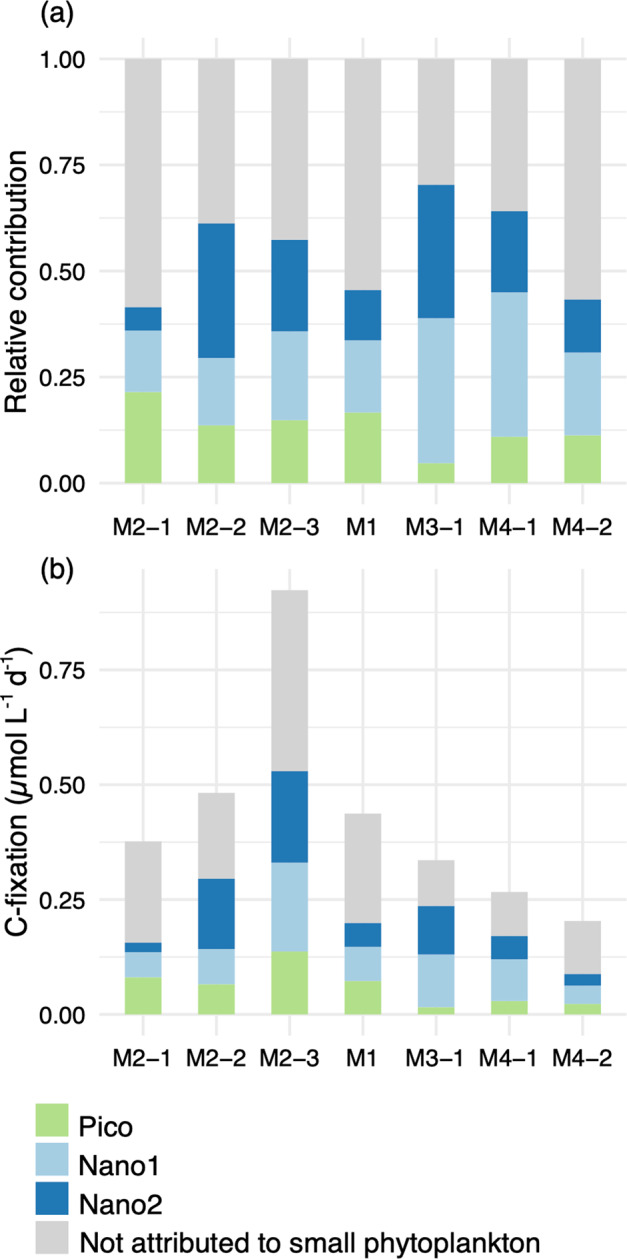
Phytoplankton is composed of a broad-sized spectrum of phylogenetically diverse microorganisms. Assessing CO2-fixation intra- and inter-group variability is crucial in understanding how the carbon pump functions, as each group of phytoplankton may be characterized by diverse efficiencies in carbon fixation and export to the deep ocean. We measured the CO2-fixation of different groups of phytoplankton at the single-cell level around the naturally iron-fertilized Kerguelen plateau (Southern Ocean), known for intense diatoms blooms suspected to enhance CO2 sequestration. After the bloom, small cells (<20 µm) composed of phylogenetically distant taxa (prymnesiophytes, prasinophytes, and small diatoms) were growing faster (0.37 ± 0.13 and 0.22 ± 0.09 division d-1 on- and off-plateau, respectively) than larger diatoms (0.11 ± 0.14 and 0.09 ± 0.11 division d-1 on- and off-plateau, respectively), which showed heterogeneous growth and a large proportion of inactive cells (19 ± 13%). As a result, small phytoplankton contributed to a large proportion of the CO2 fixation (41-70%). The analysis of pigment vertical distribution indicated that grazing may be an important pathway of small phytoplankton export. Overall, this study highlights the need to further explore the role of small cells in CO2-fixation and export in the Southern Ocean.


Conflict of interest statement

The authors declare no competing interest.

Figures

Fig. 1
Fig. 1. Map of the study area.
Surface chlorophyll a concentrations correspond to AQUA/ MODIS average values for March 2018. The orange dashed line indicates the position of the polar front after Pauthenet et al. [88].
Fig. 2
Fig. 2. Contribution of major phytoplankton groups to total Chl a with depth.
Total Chl a concentrations correspond to the cumulative concentration of taxon-specific Chl a. The panels are organized here according to the rate of decrease of small phytoplankton pigments. The black line indicates Phaeopigment:Chl a ratio. Phaeopigments correspond to degraded and Chl a to fresh pigment material. The dashed black line corresponds to a ratio of 1. a Stations have Phaeo/Chl a ratio above 1 at 200 m depth, whereas b stations the ratio is <1.
Fig. 3
Fig. 3. Heatmap showing relative abundances of sequence reads for surface phytoplankton taxa in the small (0.2–20 µm) and large (20–100 µm) size fractions.
Taxa are grouped by division (Haptophyta, Chlorophyta) or class (Bacillariophyta, Pelagophyceae, Dinophyceae, Chrysophyceae, Cryptophyceae, Bolidophyceae, and MOCH).
Fig. 4
Fig. 4. Boxplot of the daily CO2-based cell-specific division rates.
Each dot corresponds to the division rate of a single-cell measured with NanoSIMS for cells <20 µm (a, b) or with SIMS for diatoms >20 µm (c). Diamonds indicate mean division rates and inactive cells are colored in black. Significant differences (pairwise Mann–Whitney test with p < 0.05) in division rates between stations (a) or between size-groups on- and off-plateau (b) are indicated by letters above the boxplots (ranked by alphabetical order from highest to lowest division rates). Outliers correspond to the larger points.
Fig. 5
Fig. 5. Relationship between single-cell daily uptake rates of carbon (pgC d−1) and single-cell volumes for small diatoms and nonsilicified cells (<20 µm) on- (a) and off-plateau (b).
Empty circles correspond to inactive cells. Scaling exponents have been obtained by linear least-squares fitting of log-transformed data. Consequently, the amount of CO2 fixed at the single-cell level (C-fix) scaled with cell volume (V) according to the power law C-fix = aVα where a is a constant that differed on- and off-plateau and α is the scaling exponent.
Fig. 6
Fig. 6. Contribution of small phytoplankton to bulk CO2-fixation.
Relative (a) and absolute (b) contribution of the different groups of small phytoplankton to bulk CO2-fixation were obtained by multiplying mean CO2-fixation rates (nanoSIMS) by the abundance of the groups (flow cytometry enumeration). Bulk contribution was measured with EA-IRMS.

References

    1. Longhurst A, Sathyendranath S, Platt T, Caverhill C. An estimate of global primary production in the ocean from satellite radiometer data. J Plankton Res. 1995;17:1245–71. doi: 10.1093/plankt/17.6.1245. - DOI
    1. Field CB, Behrenfeld MJ, Randerson JT, Falkowski P. Primary production of the biosphere: integrating terrestrial and oceanic components. Science. 1998;281:237–40. doi: 10.1126/science.281.5374.237. - DOI - PubMed
    1. Falkowski PG, Raven JA. Aquatic photosynthesis. Princeton, NJ: Princeton University Press; 2013.
    1. Falkowski PG, Barber RT, Smetacek V. Biogeochemical controls and feedbacks on Ocean primary production. Science. 1998;281:200–6. doi: 10.1126/science.281.5374.200. - DOI - PubMed
    1. Palmer JR, Totterdell IJ. Production and export in a global ocean ecosystem model. Deep Sea Res Part Oceanogr Res Pap. 2001;48:1169–98. doi: 10.1016/S0967-0637(00)00080-7. - DOI

Publication types