Chronic social stress alters protein metabolism in juvenile rainbow trout, Oncorhynchus mykiss
- PMID: 33712903
- PMCID: PMC8043953
- DOI: 10.1007/s00360-021-01340-6
Chronic social stress alters protein metabolism in juvenile rainbow trout, Oncorhynchus mykiss
Abstract
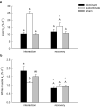
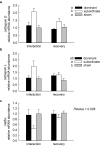
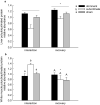
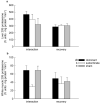
When confined in pairs, juvenile rainbow trout (Oncorhynchus mykiss) form dominance hierarchies in which subordinate fish exhibit characteristic physiological changes including reduced growth rates and chronically elevated plasma cortisol concentrations. We hypothesized that alterations in protein metabolism contribute to the reduced growth rate of socially stressed trout, and predicted that subordinate trout would exhibit reduced rates of protein synthesis coupled with increases in protein degradation. Protein metabolism was assessed in dominant and subordinate fish after 4 days of social interaction, and in fish that were separated after 4 days of interaction for a 4 days recovery period, to determine whether effects on protein metabolism recovered when social stress was alleviated. Protein metabolism was assessed in liver and white muscle by measuring the fractional rate of protein synthesis and markers of protein degradation. In the white muscle of subordinate fish, protein synthesis was inhibited and activities of the ubiquitin-proteasome pathway (UPP) and the autophagy lysosomal system (ALS) were elevated. By contrast, the liver of subordinate fish exhibited increased rates of protein synthesis and activation of the ALS. When allowed to recover from chronic social stress for 4 days, differences in protein metabolism observed in white muscle of subordinate fish during the interaction period disappeared. In liver, protein synthesis returned to baseline levels during recovery from social stress, but markers of protein degradation did not. Collectively, these data support the hypothesis that inhibition of muscle protein synthesis coupled with increases in muscle protein breakdown contribute to the reduced growth rates of subordinate rainbow trout.
Keywords: Autophagy lysosomal system; Cortisol; Fractional rate of protein synthesis; Salmonid; Social hierarchy; Ubiquitin proteasome pathway.
Figures


Similar articles
-
Regulation of energy metabolism during social interactions in rainbow trout: a role for AMP-activated protein kinase.Am J Physiol Regul Integr Comp Physiol. 2017 Nov 1;313(5):R549-R559. doi: 10.1152/ajpregu.00341.2016. Epub 2017 Aug 2. Am J Physiol Regul Integr Comp Physiol. 2017. PMID: 28768660 Free PMC article.
-
Rapid recovery of the cortisol response following social subordination in rainbow trout.Physiol Behav. 2016 Oct 1;164(Pt A):306-13. doi: 10.1016/j.physbeh.2016.06.012. Epub 2016 Jun 14. Physiol Behav. 2016. PMID: 27317163
-
Elevated cortisol lowers thermal tolerance but results in limited cardiac remodelling in rainbow trout (Oncorhynchus mykiss) experiencing chronic social stress.J Exp Biol. 2021 Jul 1;224(13):jeb238683. doi: 10.1242/jeb.238683. Epub 2021 Jul 5. J Exp Biol. 2021. PMID: 34096578
-
Social status affects lipid metabolism in rainbow trout, Oncorhynchus mykiss.Am J Physiol Regul Integr Comp Physiol. 2018 Aug 1;315(2):R241-R255. doi: 10.1152/ajpregu.00402.2017. Epub 2018 Mar 21. Am J Physiol Regul Integr Comp Physiol. 2018. PMID: 29561648 Free PMC article.
-
The influence of social status on hepatic glucose metabolism in rainbow trout Oncorhynchus mykiss.Physiol Biochem Zool. 2012 Jul-Aug;85(4):309-20. doi: 10.1086/666497. Epub 2012 Jun 8. Physiol Biochem Zool. 2012. PMID: 22705482
Cited by
-
How can early life adversity still exert an effect decades later? A question of timing, tissues and mechanisms.Front Immunol. 2023 Jun 30;14:1215544. doi: 10.3389/fimmu.2023.1215544. eCollection 2023. Front Immunol. 2023. PMID: 37457711 Free PMC article. Review.
-
Cathepsin S activity controls chronic stress-induced muscle atrophy and dysfunction in mice.Cell Mol Life Sci. 2023 Aug 17;80(9):254. doi: 10.1007/s00018-023-04888-4. Cell Mol Life Sci. 2023. PMID: 37589754 Free PMC article.
-
Multi-Approach Assessment for Stress Evaluation in Rainbow Trout Females, Oncorhynchus mykiss (Walbaum, 1792) from Three Different Farms during the Summer Season.Animals (Basel). 2021 Jun 17;11(6):1810. doi: 10.3390/ani11061810. Animals (Basel). 2021. PMID: 34204450 Free PMC article.
-
Effect of Dietary Soy Protein Source on Effluent Water Quality and Growth Performance of Rainbow Trout Reared in a Serial Reuse Water System.Animals (Basel). 2023 Oct 3;13(19):3090. doi: 10.3390/ani13193090. Animals (Basel). 2023. PMID: 37835695 Free PMC article.
-
Early Adversity and Accelerated Brain Aging: A Mini-Review.Front Mol Neurosci. 2022 Mar 22;15:822917. doi: 10.3389/fnmol.2022.822917. eCollection 2022. Front Mol Neurosci. 2022. PMID: 35392273 Free PMC article. Review.
References
-
- Abbott JC, Dill LM. Patterns of aggressive attack in juvenile steelhead trout (Salmo gairdneri) Can J Fish Aquat Sci. 1985;42:1702–1706.
-
- Abbott JC, Dill LM. The relative growth of dominant and subordinate juvenile steelhead trout (Salmo gairdneri) fed equal rations. Behaviour. 1989;108:104–113.
-
- Adams CE, Huntingford FA, Turnbull JF, Beattie C. Alternative competitive strategies and the cost of food acquisition in juvenile Atlantic salmon (Salmo salar) Aquaculture. 1998;167:17–26.
-
- Ardley HC, Robison PA. E3 ubiquitin ligases. Essays Biochem. 2005;41:15–30. - PubMed
-
- Barton BA, Schreck CB, Barton LD. Effects of chronic cortisol administration and daily acute stress on growth, physiological conditions, and stress responses in juvenile rainbow trout. Dis Aquat Org. 1987;2:173–185.
Publication types
MeSH terms
Substances
LinkOut - more resources
Full Text Sources
Other Literature Sources
Miscellaneous

