

Effects of stomach content on the breath alcohol concentration-transdermal alcohol concentration relationship
- PMID: 33713037
- PMCID: PMC8848829
- DOI: 10.1111/dar.13267
Effects of stomach content on the breath alcohol concentration-transdermal alcohol concentration relationship
Abstract
Introduction: Wearable devices that obtain transdermal alcohol concentration (TAC) could become valuable research tools for monitoring alcohol consumption levels in naturalistic environments if the TAC they produce could be converted into quantitatively-meaningful estimates of breath alcohol concentration (eBrAC). Our team has developed mathematical models to produce eBrAC from TAC, but it is not yet clear how a variety of factors affect the accuracy of the models. Stomach content is one factor that is known to affect breath alcohol concentration (BrAC), but its effect on the BrAC-TAC relationship has not yet been studied.
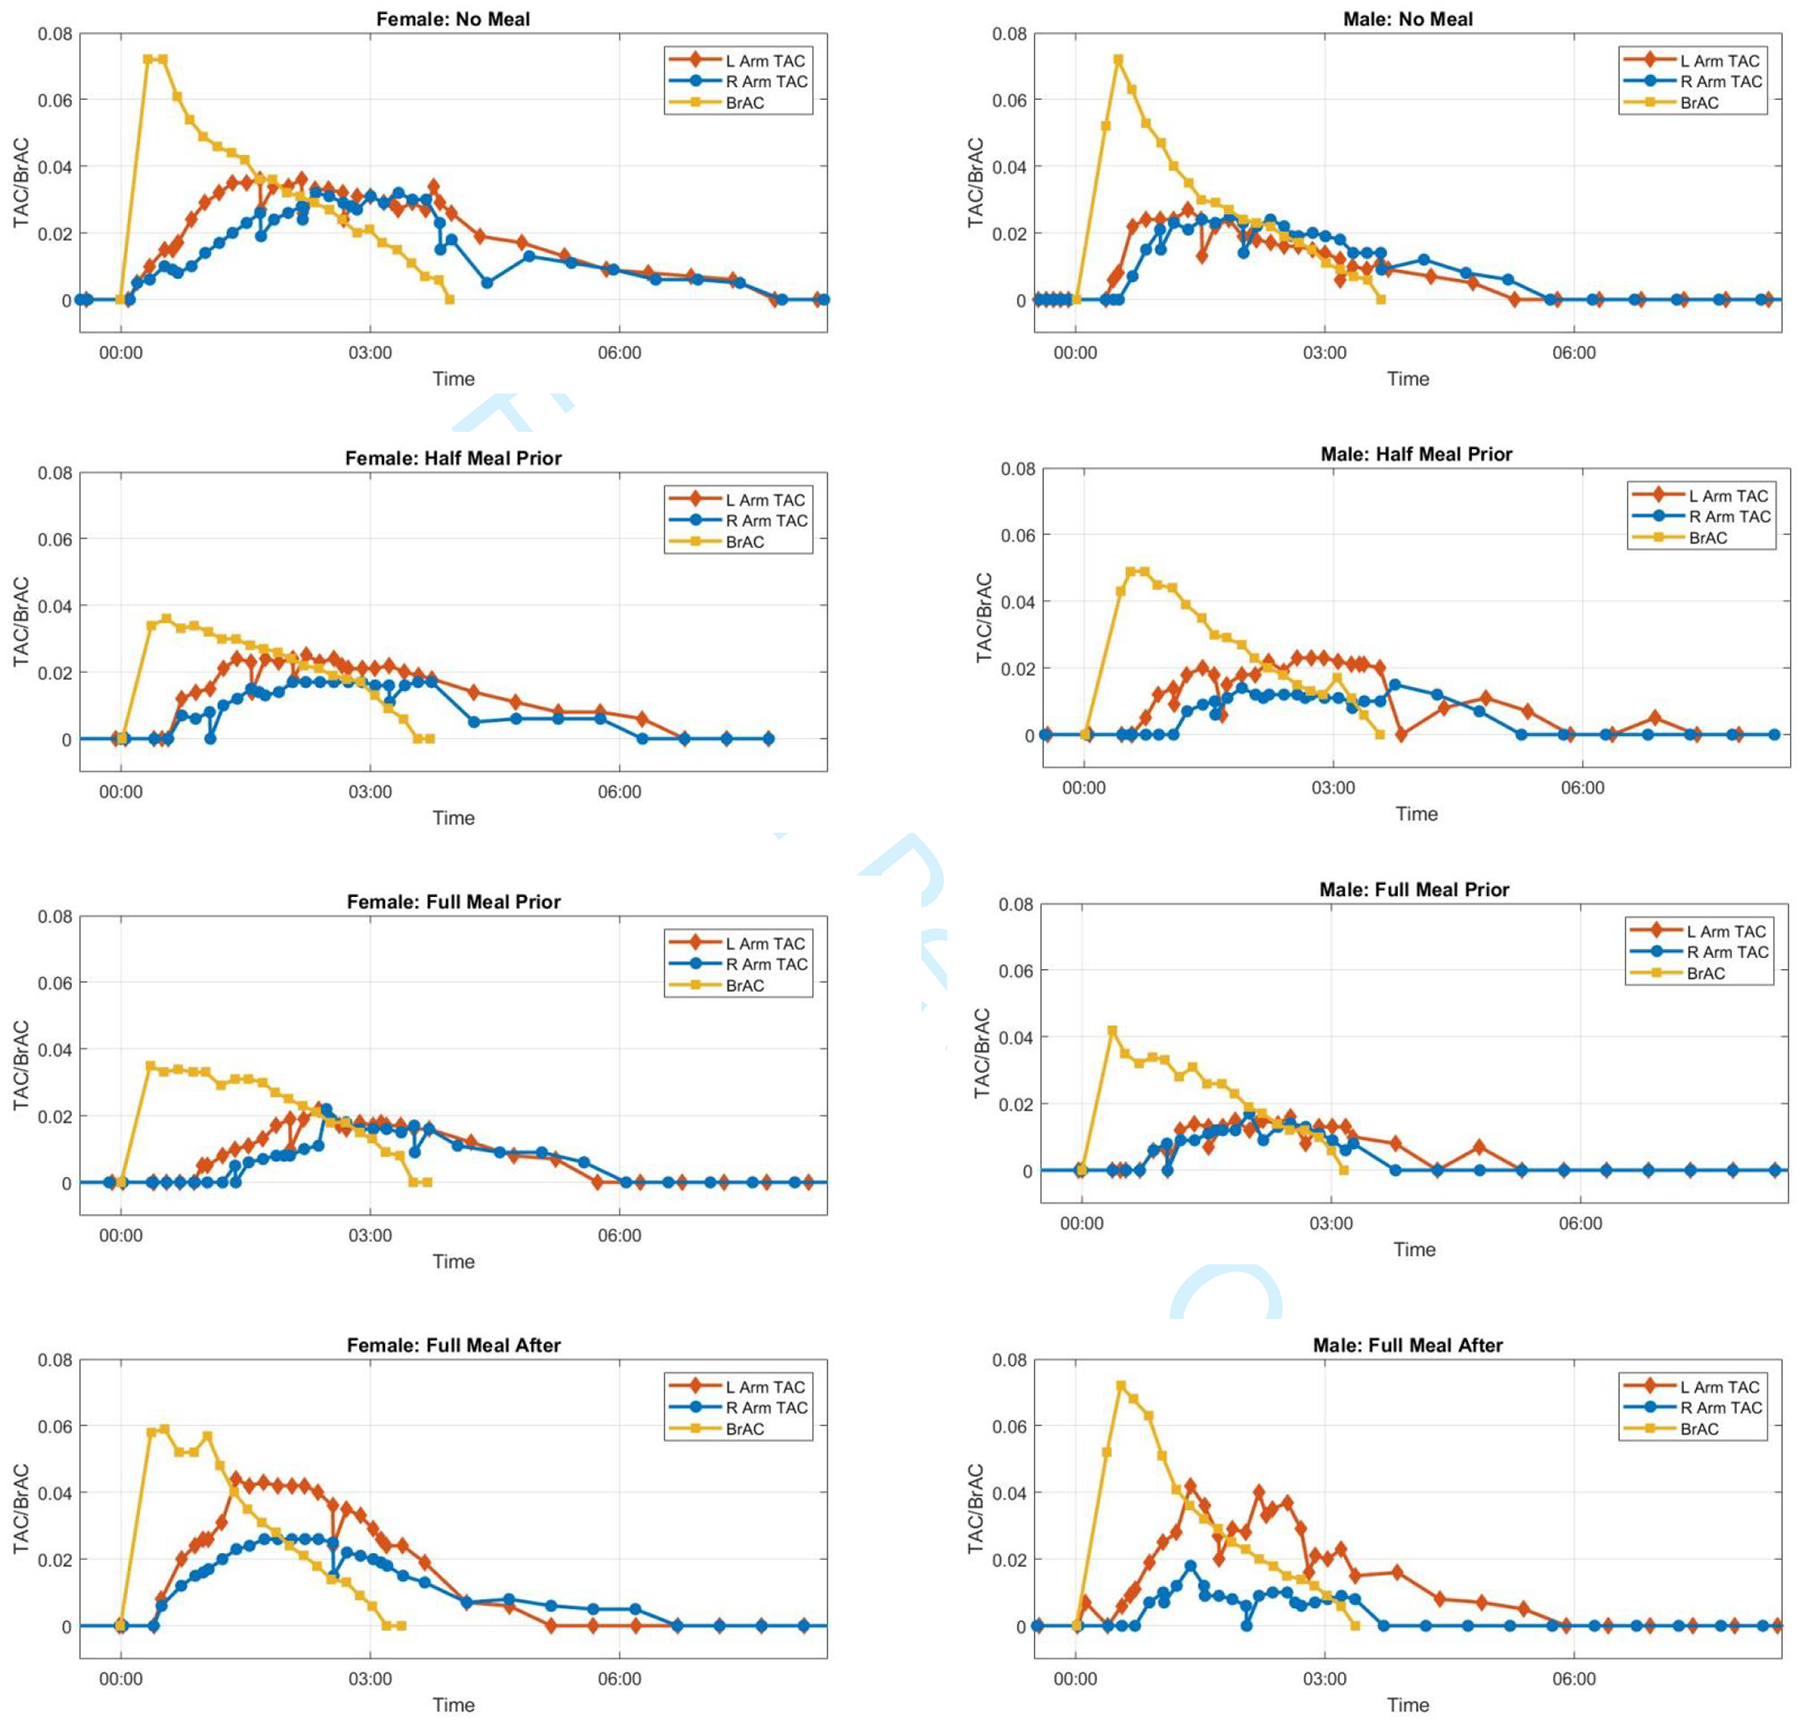
Methods: We examine the BrAC-TAC relationship by having two investigators participate in four laboratory drinking sessions with varied stomach content conditions: (i) no meal, (ii) half and (iii) full meal before drinking, and (iv) full meal after drinking. BrAC and TAC were obtained every 10 min over the BrAC curve.
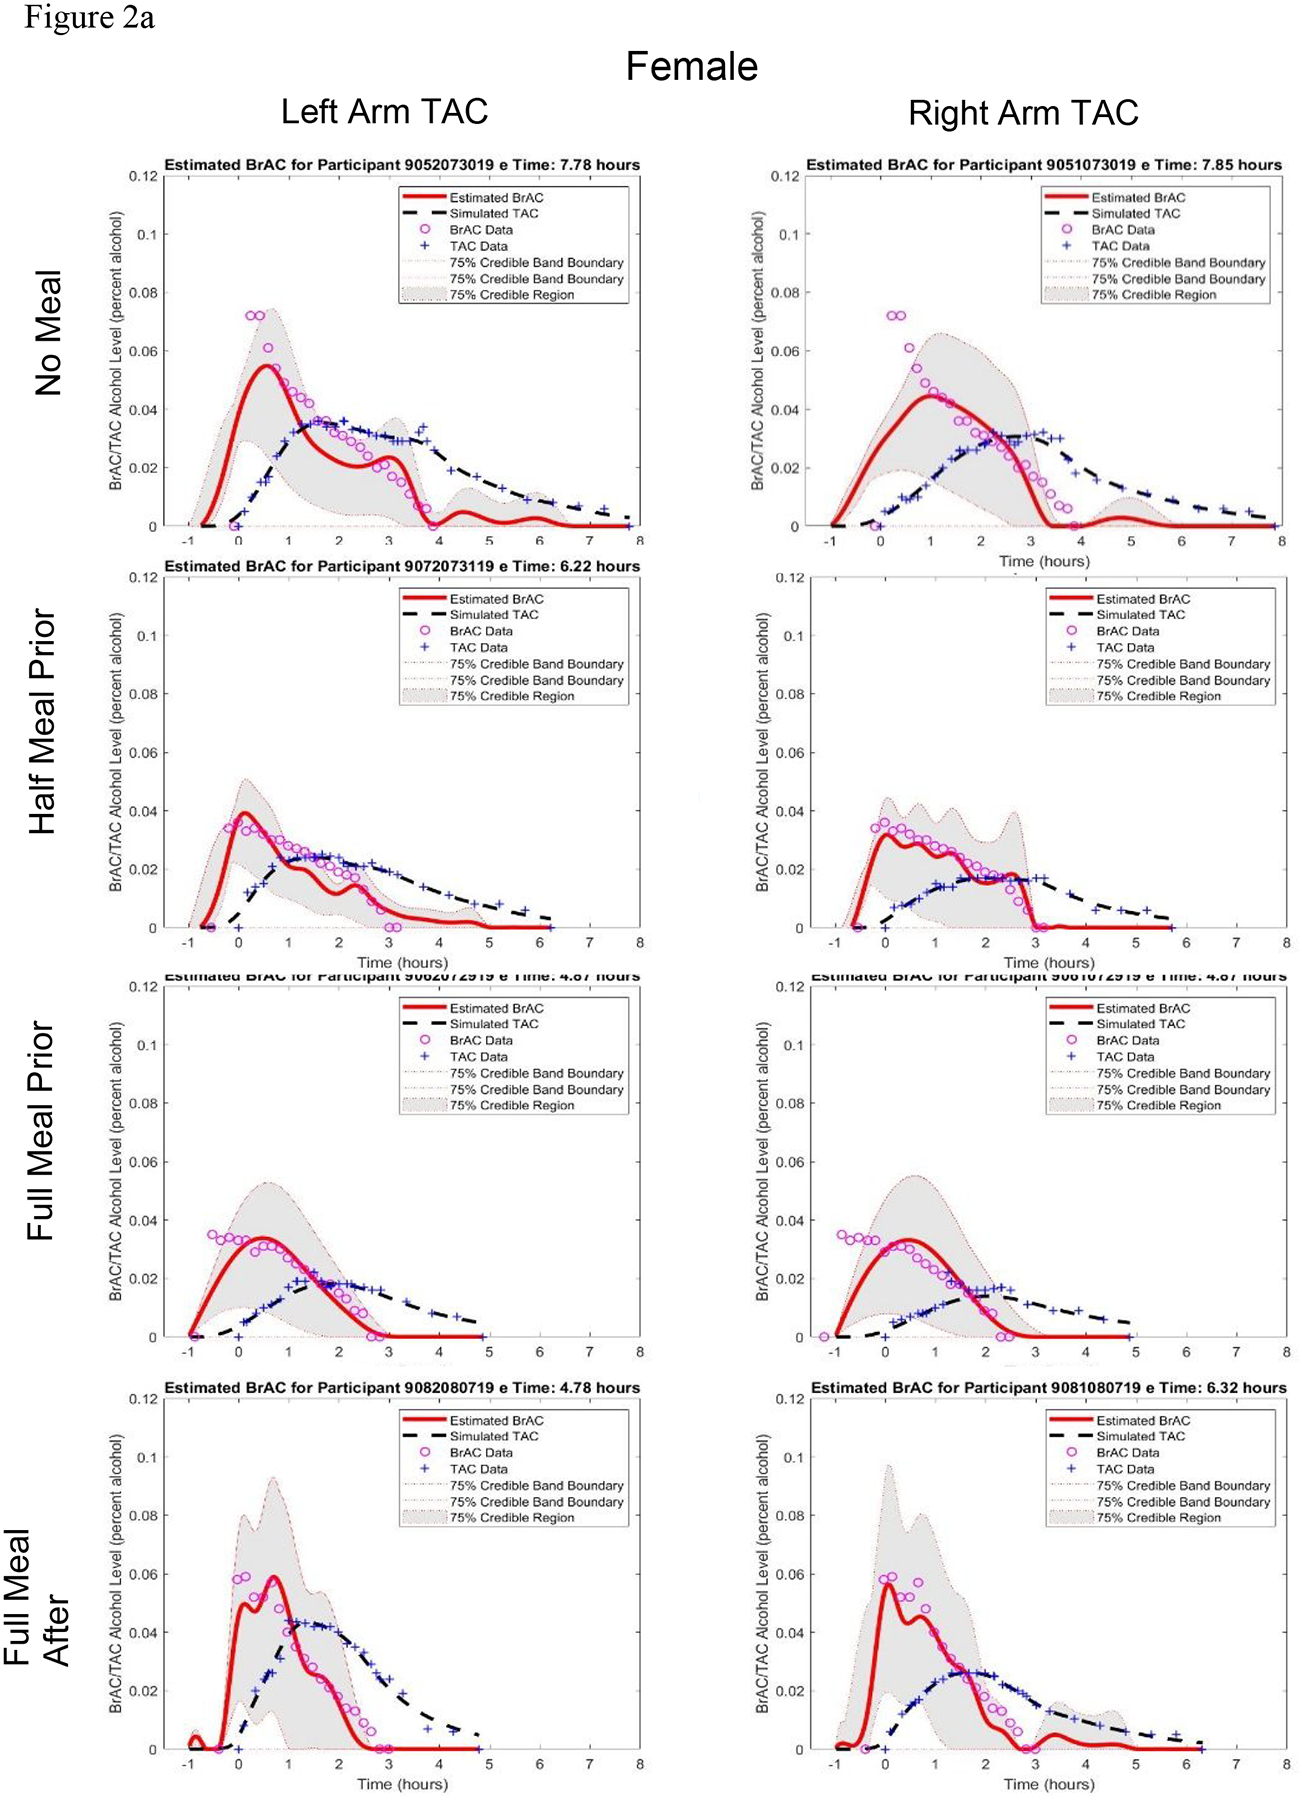
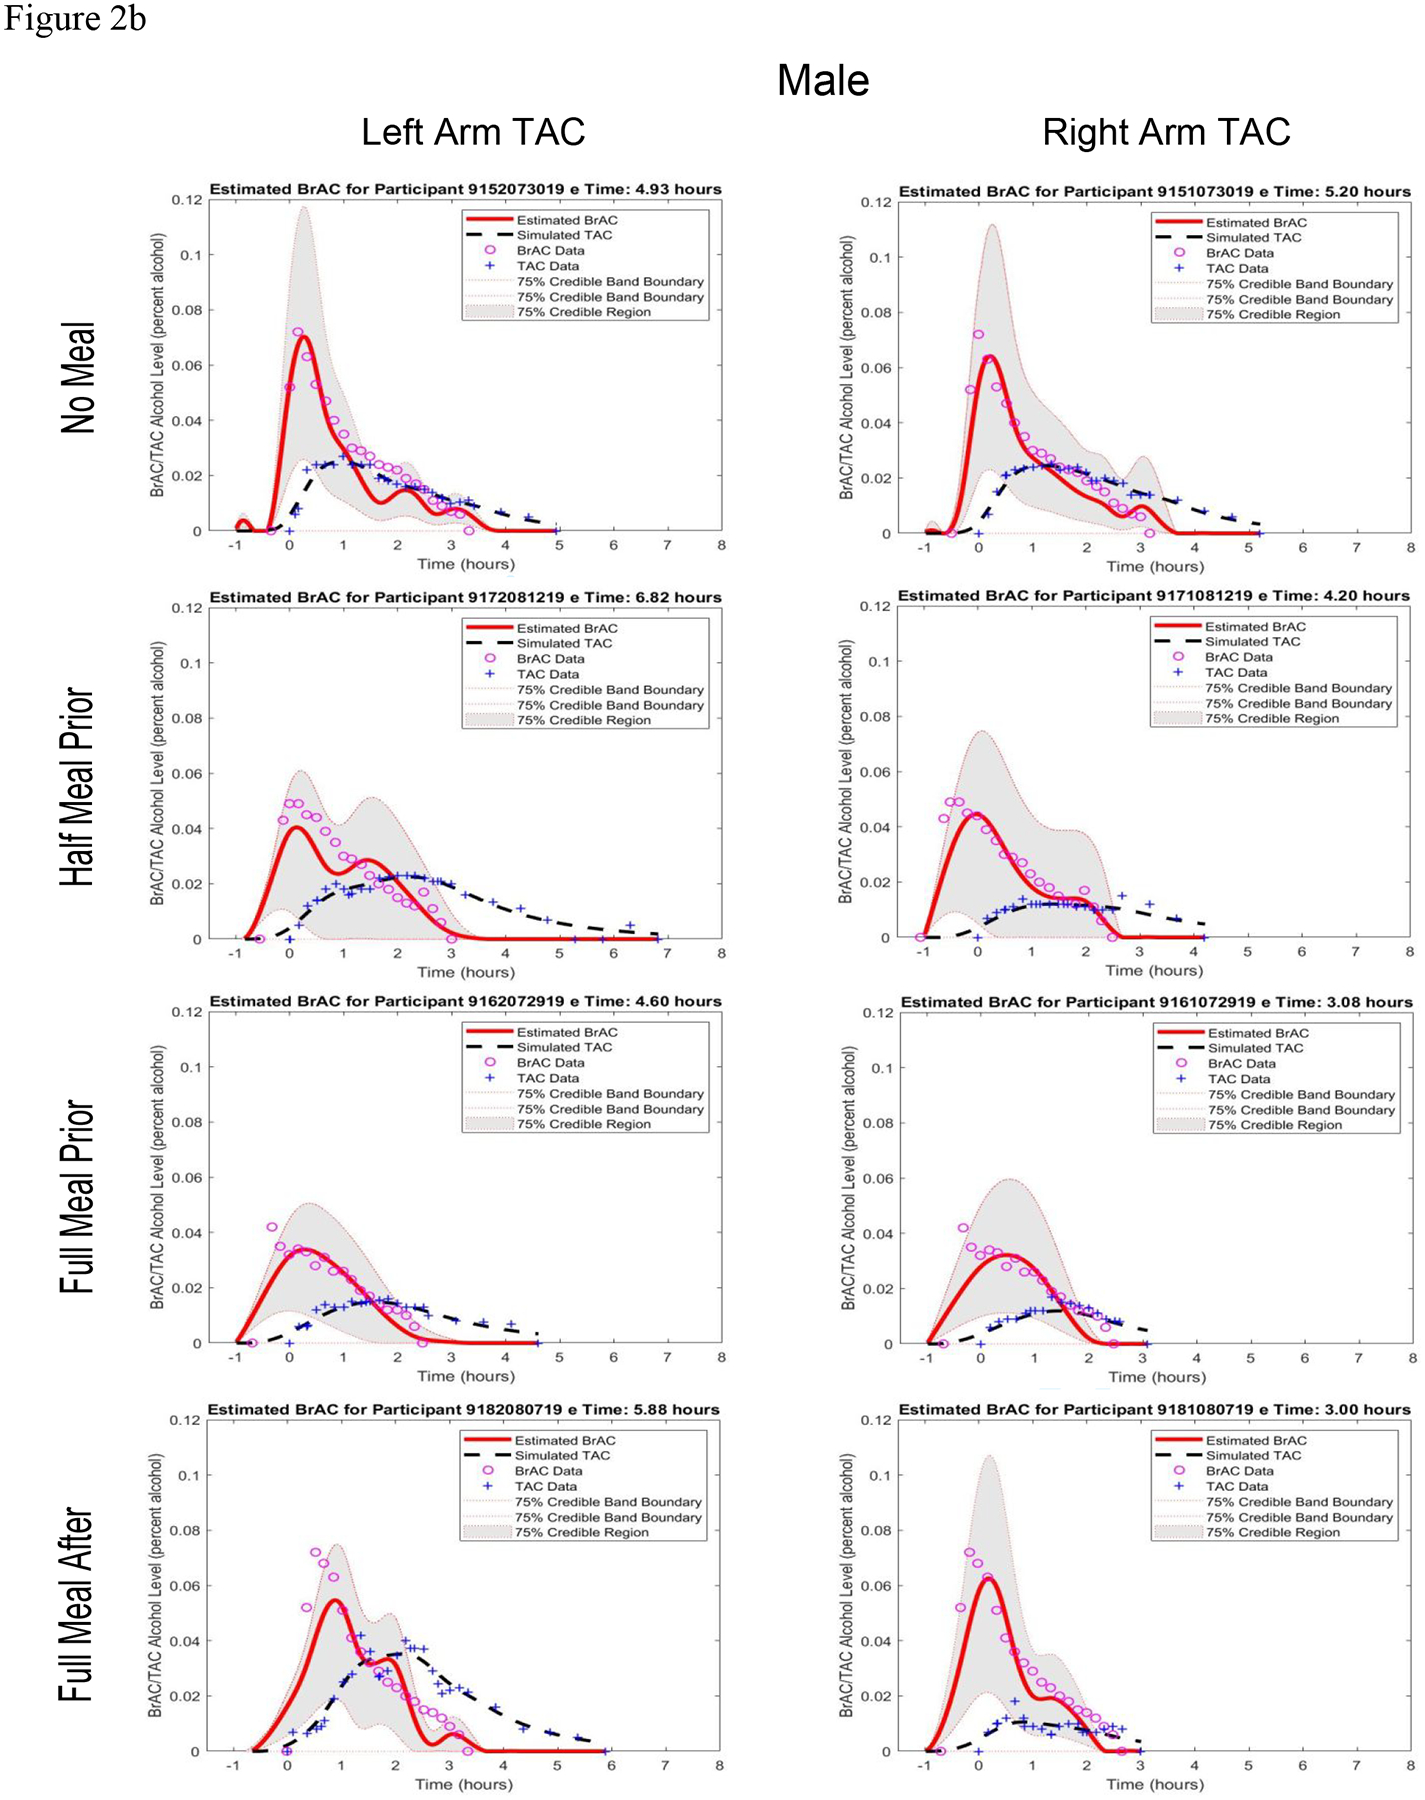
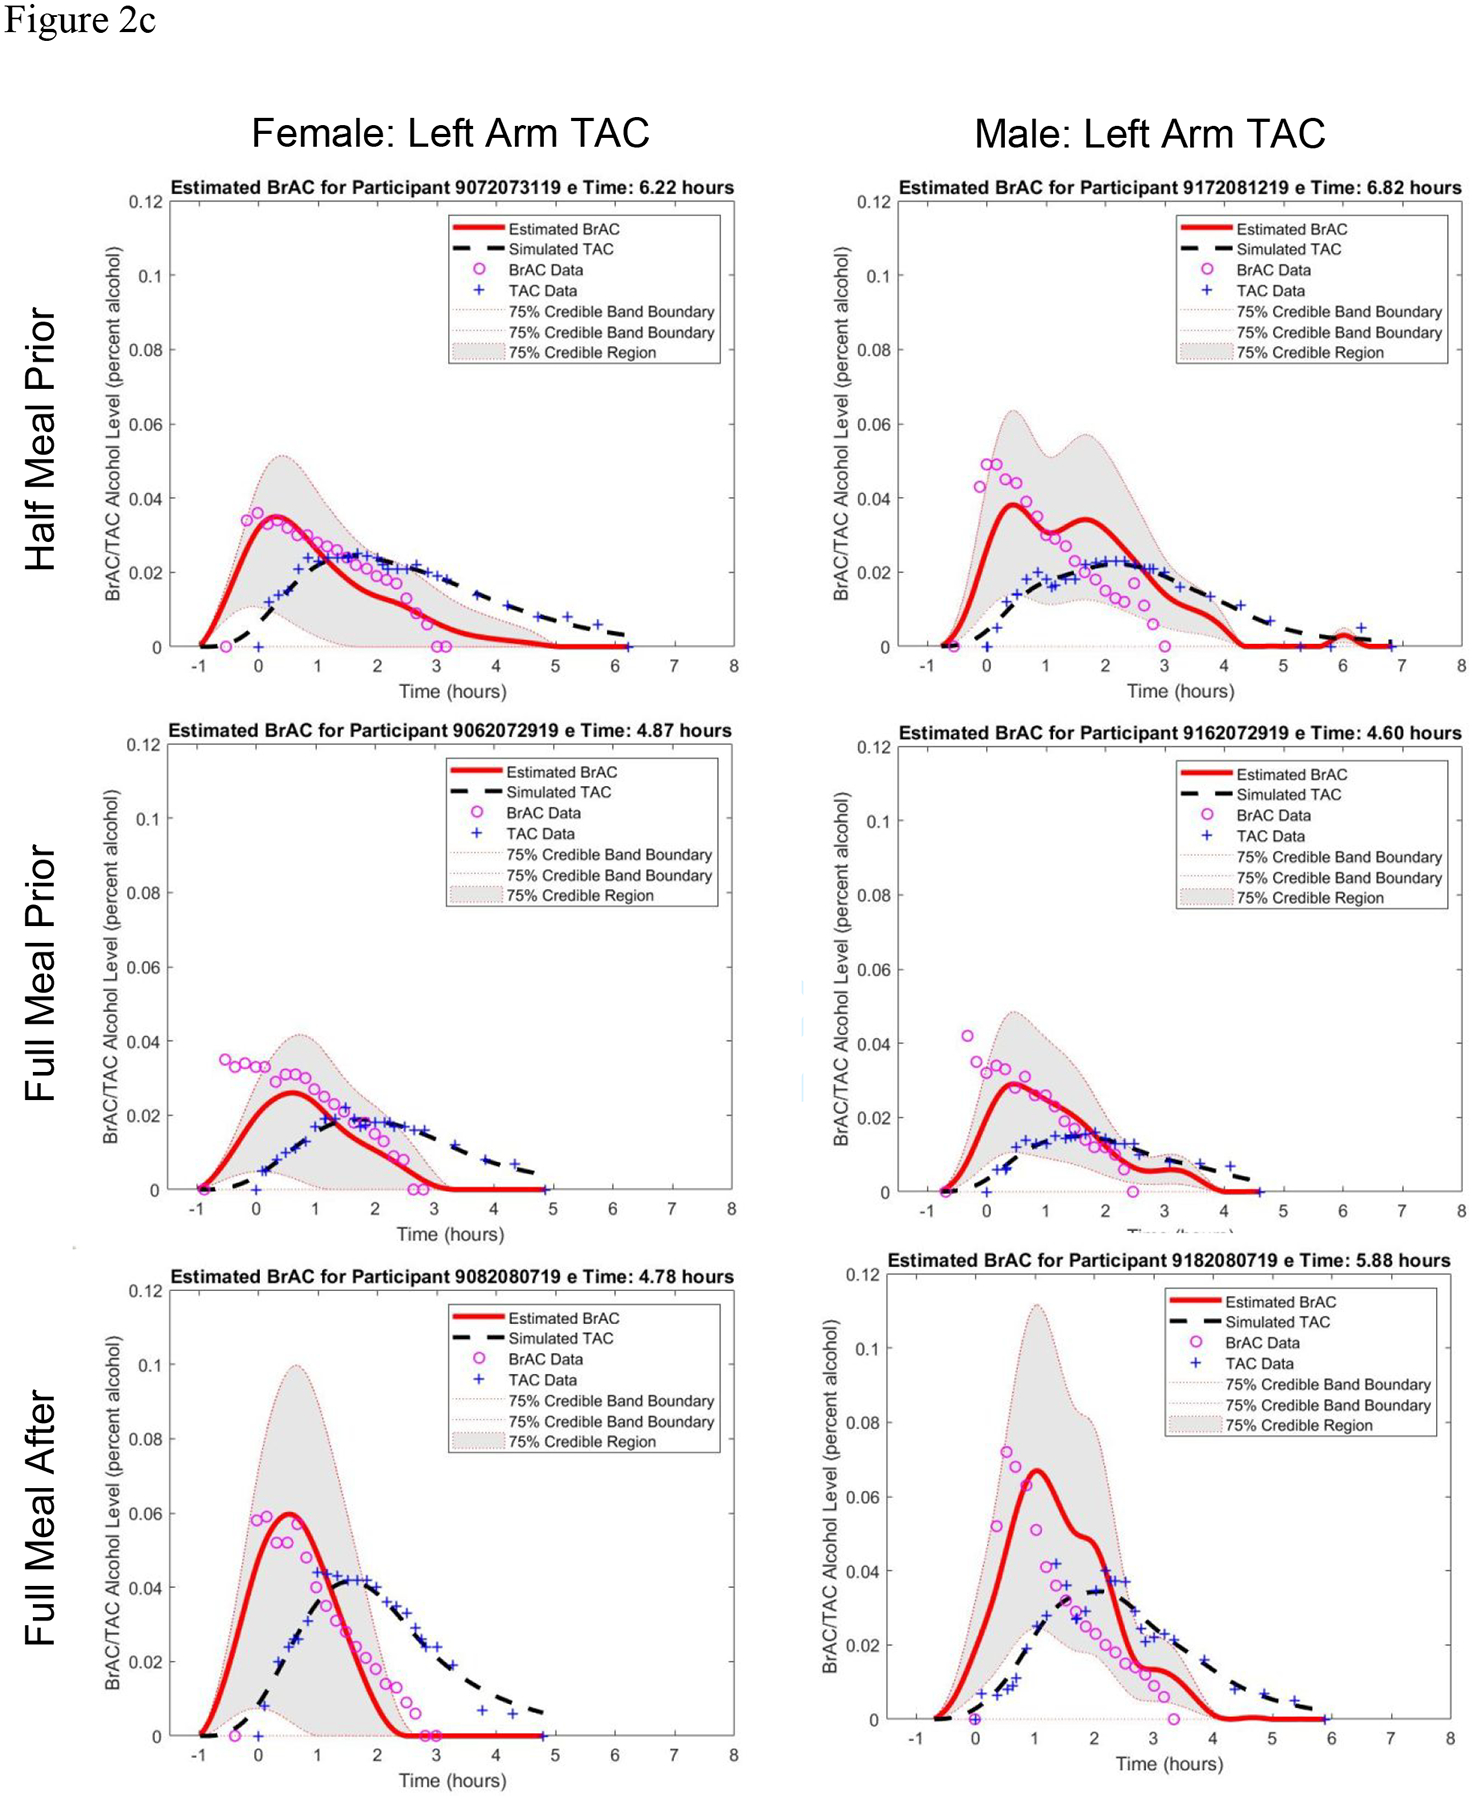
Results: Eating before drinking lowered BrAC and TAC levels, with greater variability in TAC across person-device pairings, but the BrAC-TAC relationship was not consistently altered by stomach content. The mathematical model calibration parameters, fit indices, and eBrAC curves and summary score outputs did not consistently vary based on stomach content, indicating that our models were able to produce eBrAC from TAC with similar accuracy despite variations in the shape and magnitude of the BrAC curves under different conditions.
Discussion and conclusions: This study represents the first examination of how stomach content affects our ability to model estimates of BrAC from TAC and indicates it is not a major factor.
Keywords: alcohol biosensor; breath alcohol concentration estimation; real-time assessment; stomach content; transdermal alcohol concentration.
© 2021 Australasian Professional Society on Alcohol and other Drugs.
Conflict of interest statement
Figures
Similar articles
-
Applying a novel population-based model approach to estimating breath alcohol concentration (BrAC) from transdermal alcohol concentration (TAC) biosensor data.Alcohol. 2019 Dec;81:117-129. doi: 10.1016/j.alcohol.2018.09.005. Epub 2018 Sep 20. Alcohol. 2019. PMID: 30244026 Free PMC article.
-
Obtaining continuous BrAC/BAC estimates in the field: A hybrid system integrating transdermal alcohol biosensor, Intellidrink smartphone app, and BrAC Estimator software tools.Addict Behav. 2018 Aug;83:48-55. doi: 10.1016/j.addbeh.2017.11.038. Epub 2017 Dec 2. Addict Behav. 2018. PMID: 29233567 Free PMC article.
-
Estimating BrAC from transdermal alcohol concentration data using the BrAC estimator software program.Alcohol Clin Exp Res. 2014 Aug;38(8):2243-52. doi: 10.1111/acer.12478. Alcohol Clin Exp Res. 2014. PMID: 25156615 Free PMC article.
-
Wearable Transdermal Alcohol Monitors: A Systematic Review of Detection Validity, and Relationship Between Transdermal and Breath Alcohol Concentration and Influencing Factors.Alcohol Clin Exp Res. 2020 Oct;44(10):1918-1932. doi: 10.1111/acer.14432. Epub 2020 Oct 3. Alcohol Clin Exp Res. 2020. PMID: 32767791
-
Combining transdermal and breath alcohol assessments, real-time drink logs and retrospective self-reports to measure alcohol consumption and intoxication across a multi-day music festival.Drug Alcohol Rev. 2021 Nov;40(7):1112-1121. doi: 10.1111/dar.13215. Epub 2020 Nov 10. Drug Alcohol Rev. 2021. PMID: 33174260 Review.
Cited by
-
Examining new-generation transdermal alcohol biosensor performance across laboratory and field contexts.Alcohol Clin Exp Res (Hoboken). 2023 Jan;47(1):50-59. doi: 10.1111/acer.14977. Epub 2022 Dec 12. Alcohol Clin Exp Res (Hoboken). 2023. PMID: 36433786 Free PMC article.
-
Validating transdermal alcohol biosensors: a meta-analysis of associations between blood/breath-based measures and transdermal alcohol sensor output.Addiction. 2022 Nov;117(11):2805-2815. doi: 10.1111/add.15953. Epub 2022 Jun 12. Addiction. 2022. PMID: 35603913 Free PMC article. Review.
-
Breath Alcohol Test Results in Equine Veterinarians after Performing an Abdominal Ultrasound with Ethanol.Vet Sci. 2023 Mar 14;10(3):222. doi: 10.3390/vetsci10030222. Vet Sci. 2023. PMID: 36977261 Free PMC article.
-
Fat-free mass accounts for most of the variance in alcohol elimination rate in women.Alcohol Clin Exp Res (Hoboken). 2023 May;47(5):848-855. doi: 10.1111/acer.15047. Epub 2023 Mar 14. Alcohol Clin Exp Res (Hoboken). 2023. PMID: 36871954 Free PMC article.
References
-
- Luczak SE, Ramchandani VA. Special issue on alcohol biosensors: Development, use, and state of the field: Summary, conclusions, and future directions. Alcohol 2019;81:161–165. - PubMed
-
- Swift RM, Swette L. Assessment of ethanol consumption with a wearable, electronic ethanol sensor/recorder. In: Litten RZ, Allen JP eds. Measuring alcohol consumption. Humana Press, Totowa, NJ. Totowa, NJ: Humana Press, 1992:189–202.
-
- Swift R. Direct measurement of alcohol and its metabolites. Addiction 2003;98:73–80. - PubMed
Publication types
MeSH terms
Substances
Grants and funding
LinkOut - more resources
Full Text Sources
Other Literature Sources
Medical
