. 2021 Apr;10(8):2826-2839.
doi: 10.1002/cam4.3829. Epub 2021 Mar 12.

Integrative analysis regarding the correlation between GAS2 family genes and human glioma prognosis

Affiliations

Integrative analysis regarding the correlation between GAS2 family genes and human glioma prognosis

Chunyan Zhao et al. Cancer Med. 2021 Apr.

Abstract

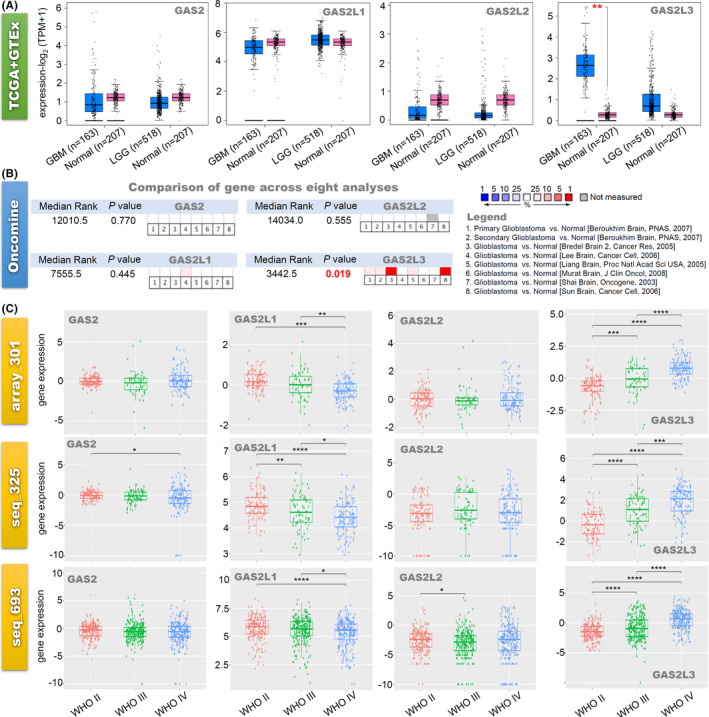
Background: Emerging oncogenes were reportedly linked to the complicated subtypes and pathogenesis of clinical gliomas. Herein, we first comprehensively explored the potential correlation between growth-arrest-specific two family genes (GAS2, GAS2L1, GAS2L2, GAS2L3) and gliomas by bioinformatics analysis and cellular experiments.

Methods: Based on the available datasets of TCGA (The Cancer Genome Atlas), CGGA (Chinese Glioma Genome Atlas), and Oncomine databases, we performed a series of analyses, such as gene expression, survival prognosis, DNA methylation, immune infiltration, and partner enrichment. We also utilized two glioma cell lines to conduct the colony formation and wound-healing assay.

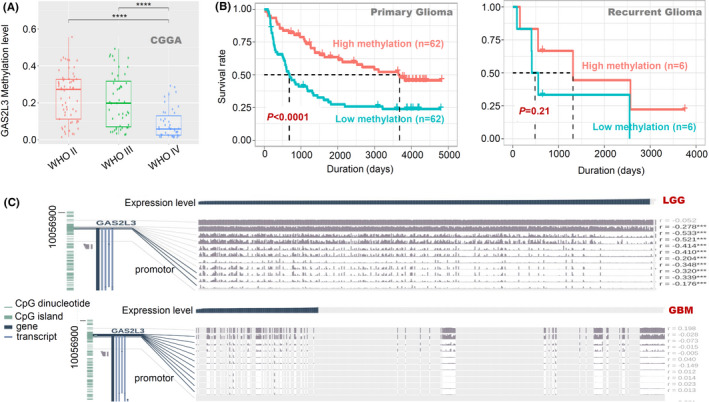
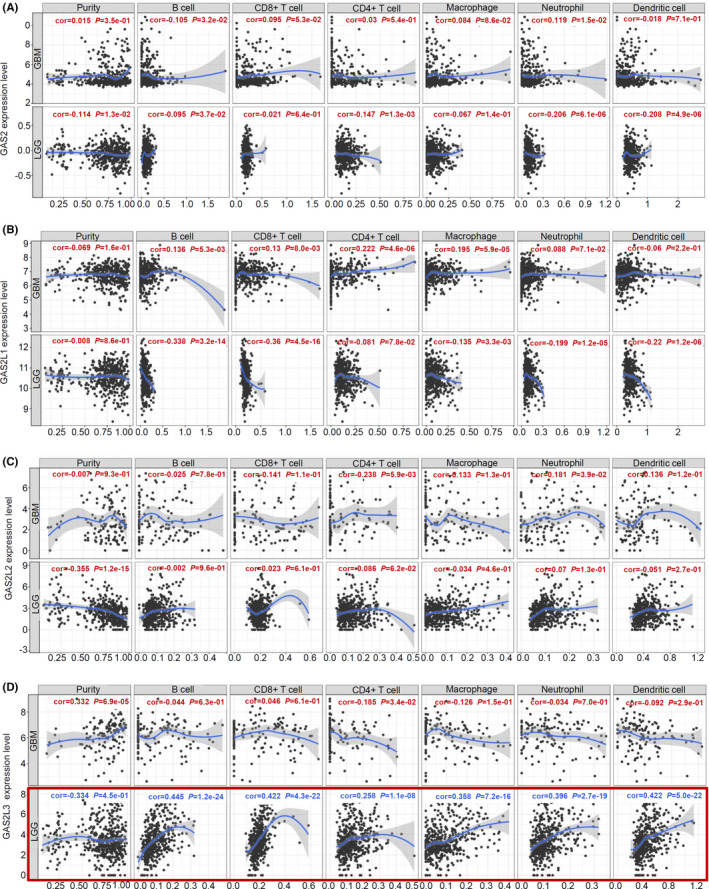
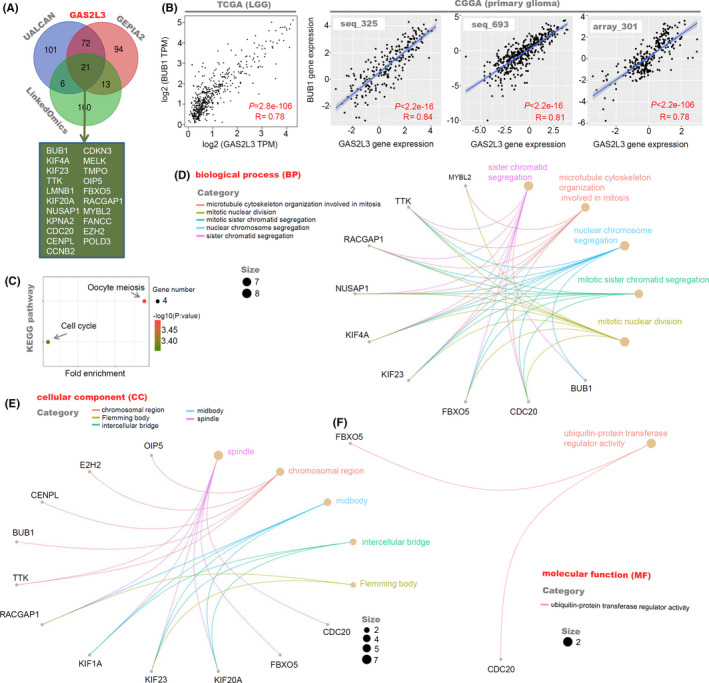
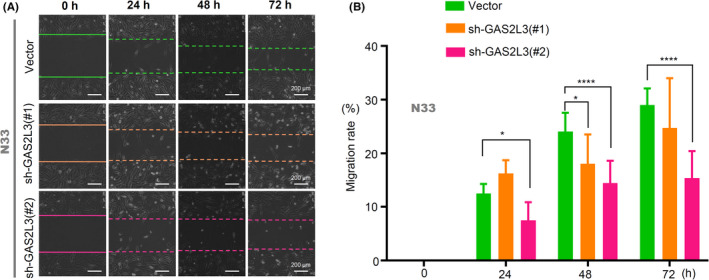
Results: GAS2L3 gene was highly expressed in glioma tissues compared to normal brain tissues (p < 0.05). We further observed the relationship between the high expressed GAS2L3 and poor clinical prognosis of brain low-grade glioma (LGG) cases in our Cox proportional hazard model (hazard ratio [HR] = 0.1715, p < 0.001). Moreover, DNA hypomethylation status of GAS2L3 was correlated with the high expression of GAS2L3 in LGG tissues and the poor clinical prognosis of primary glioma cases (p < 0.05). We also found that the high expression of GAS2L3 was associated with the infiltration level of immune cells, especially the T cells (p < 0.0001). Functional enrichment analysis of GAS2L3-correlated genes and interaction partners further indicated that GAS2L3 might take part in the occurrence of glioma by influencing a series of biological behaviors, such as cell division, cytoskeleton binding, and cell adhesion. Additionally, our cellular experiment data suggested that a highly expressed GAS2L3 gene contributes to the enhanced proliferation and migration of glioma cells.

Conclusion: This study first analyzed the potential role of GAS2 family genes, especially GAS2L3, in the clinical prognosis and possible functional mechanisms of glioma, which gives a novel insight into the relationship between GAS2L3 and LGG.

Keywords: GAS2; GAS2L1; GAS2L2; GAS2L3; glioma.


Conflict of interest statement

The authors declare no competing financial interests.

Figures

FIGURE 1
FIGURE 1
The expression analysis of GAS2 family genes in glioma. (A) We analyzed the expression levels of GAS2, GAS2L1, GAS2L2, and GAS2L3 in glioma tissues in the TCGA‐LGG/GBM project and normal brain tissues in the GTEx database. (B) Based on the eight analyses of the Oncomine database, we comprehensively analyze the expression difference of GAS2 family genes between normal control and glioblastoma. (C) We investigated the association between GAS2 family gene expression and glioma World Health Organization (WHO) classifications (WHO II, III, and IV), based on the three datasets (array_301, seq_325, seq_693) of the CGGA. *p < 0.05; **p < 0.01; ***p < 0.001; ****p < 0.0001
FIGURE 2
FIGURE 2
Correlation between GAS2 family genes expression and glioma prognosis (TCGA‐LGG/GBM). Based on the data of the TCGA‐LGG/GBM project, we performed the (A) OS and (B) DFS analysis to study the correlation of GAS2 family genes expression with the prognosis of glioma through the GEPIA2 tool. The survival map and Kaplan–Meier curve were provided, respectively
FIGURE 3
FIGURE 3
DNA methylation analysis of the GAS2L3 gene in glioma patients. Based on the Methyl_159 dataset of CGGA, we investigated (A) the potential association of DNA methylation status of GAS2L3 with the glioma WHO classifications or (B) the clinical prognosis of primary/recurrent glioma. (C) We also utilized the tools of MEXPRESS to analyze the correlation between gene expression and the methylation status of different sites, based on the data of the TCGA‐LGG/GBM project, respectively. ***p < 0.001; ****p < 0.0001
FIGURE 4
FIGURE 4
Correlation analysis between GAS2 family genes expression and immune cell infiltration level in glioma patients (TIMER). Based on the data of TCGA‐LGG/GBM, we utilized the TIMER tool to analyze the potential correlation between the expression level of (A) GAS2, (B) GAS2L1, (C) GAS2L2, and (D) GAS2L3, and infiltration level of the immune cells, including B cell, CD8+ T cell, CD4+ T cell, macrophage, neutrophil, and dendritic cell, respectively
FIGURE 5
FIGURE 5
GAS2L3‐correlated gene enrichment analysis in LGG patients. (A) We screened out three lists of the top 200 GAS2L3‐correlated genes, through UALCAN, GEPIA2, and LinkedOmics, and performed the intersection analysis by the Venn tool. (B) We utilized the “Correlation Analysis” function of GEPIA2 or CGGA to analyze the expression correlation between GAS2L3 and BUB1 gene. (C) KEGG pathway analysis was then performed by the DAVID tool and ggplot2 package. The (D) BP, (E) CC, (F) and MF data in GO analysis were also provided
FIGURE 6
FIGURE 6
The effect of GAS2L3 gene expression on the proliferation of glioma cells. (A) A western blotting assay was performed to detect the expression level of GAS2L3 protein in N9/N33 glioma cell lines, using anti‐GAS2L3 or anti‐GAPDH antibody as the control. (B) The expression status of the GAS2L3‐Flag fusion protein was detected in N9‐IRES‐Vector and N9‐IRES‐GAS2L3‐Flag stable cell lines through a western blotting assay by anti‐GAS2L3, anti‐Flag, or anti‐GAPDH antibody. (C) Then, a colony formation assay was conducted. Similarly, we also performed a (D) western blotting assay and (E) colony formation assay using the N33‐pLKO‐Vector, N33‐pLKO‐shGAS2L3‐#1, and N33‐pLKO‐shGAS2L3‐#2 cells. The colony number was calculated and analyzed by Student's t test (***p < 0.001) or ANOVA test (*p < 0.05, **p < 0.01)
FIGURE 7
FIGURE 7
The effect of GAS2L3 gene expression on the migration of glioma cells. N33‐pLKO‐Vector, N33‐pLKO‐shGAS2L3‐#1, and N33‐pLKO‐shGAS2L3‐#2 cells were used for the wound‐healing assay. (A) The images were provided. Scale bar, 200 µm. (B) The migration rate were calculated and analyzed by ANOVA test (*p < 0.05, ****p < 0.0001)

Similar articles

Cited by

References

    1. Gusyatiner O, Hegi ME. Glioma epigenetics: From subclassification to novel treatment options. Semin Cancer Biol. 2018;51:50‐58. - PubMed
    1. Chen R, Smith‐Cohn M, Cohen AL, Colman H. Glioma subclassifications and their clinical significance. Neurotherapeutics. 2017;14(2):284‐297. - PMC - PubMed
    1. Hervey‐Jumper SL, Berger MS. Maximizing safe resection of low‐ and high‐grade glioma. J Neurooncol. 2016;130(2):269‐282. - PubMed
    1. Jooma R, Waqas M, Khan I. Diffuse low‐grade glioma—changing concepts in diagnosis and management: a review. Asian J Neurosurg. 2019;14(2):356‐363. - PMC - PubMed
    1. Morshed RA, Young JS, Hervey‐Jumper SL, Berger MS. The management of low‐grade gliomas in adults. J Neurosurg Sci. 2019;63(4):450‐457. - PubMed

Publication types

MeSH terms