. 2021 May 17;218(1):iyab041.
doi: 10.1093/genetics/iyab041.

A novel allele of SIR2 reveals a heritable intermediate state of gene silencing

Affiliations

A novel allele of SIR2 reveals a heritable intermediate state of gene silencing

Delaney Farris et al. Genetics. .

Abstract

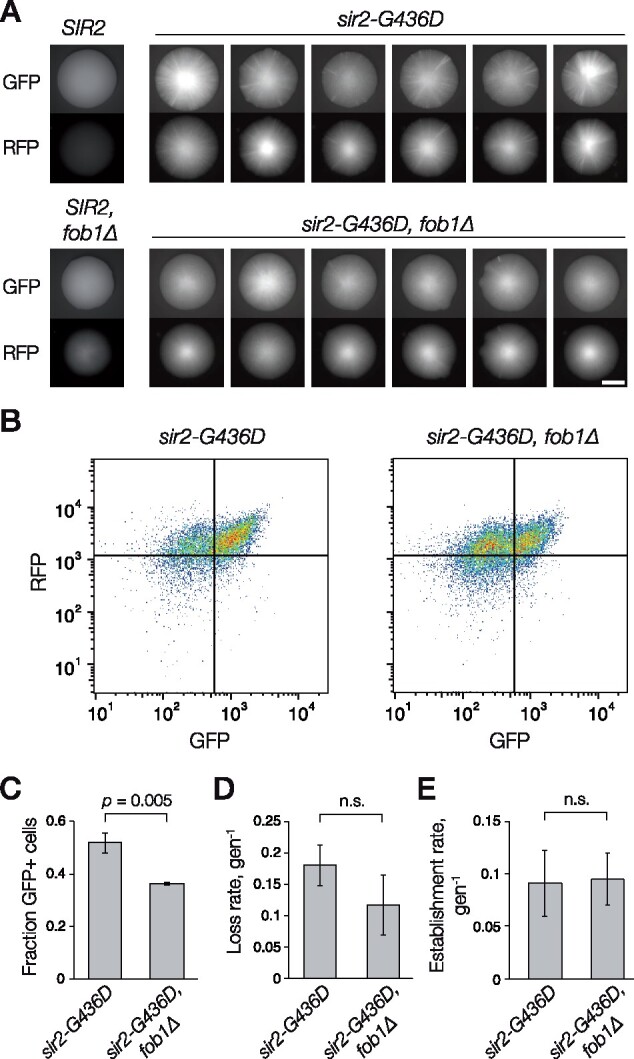
Genetic information acquires additional meaning through epigenetic regulation, the process by which genetically identical cells can exhibit heritable differences in gene expression and phenotype. Inheritance of epigenetic information is a critical step in maintaining cellular identity and organismal health. In Saccharomyces cerevisiae, one form of epigenetic regulation is the transcriptional silencing of two mating-type loci, HML and HMR, by the SIR-protein complex. To focus on the epigenetic dimension of this gene regulation, we conducted a forward mutagenesis screen to identify mutants exhibiting an epigenetic or metastable silencing defect. We utilized fluorescent reporters at HML and HMR, and screened yeast colonies for epigenetic silencing defects. We uncovered numerous independent sir1 alleles, a gene known to be required for stable epigenetic inheritance. More interestingly, we recovered a missense mutation within SIR2, which encodes a highly conserved histone deacetylase. In contrast to sir1Δ, which exhibits states that are either fully silenced or fully expressed, this sir2 allele exhibited heritable states that were either fully silenced or expressed at an intermediate level. The heritable nature of this unique silencing defect was influenced by, but not completely dependent on, changes in rDNA copy number. Therefore, this study revealed a heritable state of intermediate silencing and linked this state to a central silencing factor, Sir2.

Keywords: Sir2; epigenetic inheritance; transcriptional silencing.


Figures

Figure 1
Figure 1
A screen for metastable silencing mutants revealed eight unique alleles of sir1. (A) Schematic of the FLAME reporter strain (JRY12860) used in this study: fluorescent reporters yEGFP and yEmRFP replaced α2 at HMRα and HMLα, respectively. (B) Colony phenotypes of control strains (JRY12860–JRY12862) in both the GFP and RFP channel. Colonies were grown on YPD and imaged at identical exposures (Scale bar, 4 mm). (C) Representative colony images of diploid strains for the dominance and complementation tests. For dominance testing, a MATa wild-type FLAME strain was mated with MATα mutant strain (JRY11955 and JRY11915); for complementation testing, a MATa sir1Δ strain was mated with a MATα mutant strain (JRY11957 and JRY11950). (D) A schematic of the sir1 alleles identified. The SIR1 gene encodes a 654 amino acid protein (top bar in dark blue). Mutant alleles contained either a missense mutation or a nonsense mutation. Premature stop codons are indicated with an asterisk, i.e., sir1-W52*. (E) Colony images of the engineered single point mutation sir1 alleles, imaged on YPD in both the GFP and RFP channel. Differences in fluorescence profiles between colonies mostly reflect the high degree of variability between colonies of a given genotype, rather than differences between genotypes.
Figure 2
Figure 2
Characterization of mutant sir2-G436D. (A) Representative colony images of FLAME control strains, the mutant of interest, and sir2-G436D in both the GFP and RFP channel (JRY12860, JRY12259, JRY12861, JRY12466, and JRY12564), grown on YPD. (B) Colony images of FLAME strain SIR+ colonies and two biological replicates of the engineered single point mutation strain (JRY12860 and JRY12564). Colonies were grown on CSM and imaged at approximately 10-fold longer exposure than (A) (Scale bar, 4 mm). (C) Flow cytometry plots of the fluorescence profiles for both hmlα2Δ::RFP (PE-Texas Red) and hmrα2Δ::GFP (FITC). Cells were grown in CSM liquid media for 24 h, fixed, and analyzed. Quadrants were established using SIR+ and sir2Δ strains (JRY12860 and JRY12466), and the resulting percentage of the population per quadrant was labeled in the corresponding corner. sir1Δ cells (JRY12861) exhibited distinct populations in all four quadrants, while sir2-G436D (JRY12564) cells exhibited fully silenced states and intermediate silenced states. (D) Patch mating assays of SIR2 and sir2-G436D in MATa (JRY4012 and JRY12667) and MATα (JRY4013 and JRY12669) cells. The extent of growth on the YM minimal media reflected the strength of silencing. A complete loss of silencing, such as that seen in sir2Δ, would yield no mating and therefore no growth. (E) Results of the α-factor confrontation assay (JRY4012 and JRY12667). HML silencing was calculated by dividing the number of α-factor responsive cells by the total number of cells assayed. A complete loss of silencing, such as that seen in sir2Δ, would cause all cells to be α-factor resistant.
Figure 3
Figure 3
Live-cell imaging revealed the intermediate and heritable sir2-G436D expression state. (A) GFP and merged (bright-field and GFP) fluorescence microscopy images of sir1Δ and sir2-G436D cells (JRY12861 and JRY12564), imaged with identical exposures. (B) Distribution of the cell size for both sir1Δ and sir2-G436D, with number of cells on the y-axis and cell area in μm2 on the x-axis. (C) Distribution of the GFP mean fluorescence intensity (arbitrary units, a.u.) per cell for both sir1Δ and sir2-G436D. Dashed lines demarcate the boundaries of the three fluorescence states: HMR off, HMR intermediate, and HMR on. Details on how thresholds were assigned are in Materials and Methods. (D) GFP mean fluorescence intensity for individual sir1Δ cells over 6.5 h. Twelve individual cells were monitored, and 4 representative fluorescence trajectories are displayed. Each solid line represents a single cell that maintained a similar fluorescence level over the timecourse, whereas each dashed line represents a single cell that experienced a change in fluorescence. (E) Same as (D), but for 4 individual sir2-G436D cells. (F) Frequency at which either mother–daughter pairs or random pairs of cells exhibited the same expression state, as determined by threshold values in (C). Five different fields-of-view were analyzed (n > 50 random pairs and n > 50 mother–daughter pairs per field-of-view). Data are means ± SD. A two-tailed t-test was used for statistical analysis. (G) An example of the pattern of divisions and pedigrees designated as “heritable” versus a “switch” in sir2-G436D cells. A single mother cell (m, t = 0 min) budded twice, producing daughter 1 (d1, t = 90 min) and daughter 2 (d2, t = 180 min). Budding of daughter 1 gave rise to a grand-daughter (gd, t = 180 min) cell. In the “heritable” example, all cells at all time points displayed a fluorescence level falling within the “HMR intermediate” range; in the “switch” example, a loss of silencing occurred during the second division, giving rise to cells with fluorescence classified as “HMR intermediate.” (H) Bar chart showing the fraction of pedigrees designated as a “switch” or “heritable.” Two hundred and fifty pedigrees were observed per genotype, with the number of pedigrees per category above each bar.
Figure 4
Figure 4
Sir2-G436D levels were partially responsible for variegated silencing. (A) A schematic of the Sir2 protein and its crystal structure (Hall and Ellenberger, unpublished results; Hsu et al. 2013). The N-terminal helical domain (dark blue) and C-terminal catalytic domain (light blue) are indicated. The crystal structure spans from amino acid 211-555 and contains a zinc ion (brown), zinc-coordinating cysteines (pink), and the site of the Sir2-G436D point mutation (red). The inset shows the zinc-coordinating site in Sir2. (B) Immunoblot to detect Sir2-V5, Sir2-G436D-V5, and an internal loading control Hxk2 (JRY12589, JRY12590). Protein levels were quantified, normalized to the loading control, and compared to wild-type Sir2-V5 levels. A biological replicate was performed and is presented in Supplementary Figure S5. (C) Representative colony images of SIR2 (JRY12860) or sir2-G436D (JRY12564) plus a 2-micron plasmid vector (pRS426) or a 2-micron plasmid containing sir2-G436D (pJR3525). Six colonies are shown for each sir2-G436D strain. Colonies were grown on CSM -Ura to select for plasmids. Scale bar, 3 mm. (D) Representative flow cytometry profiles of same strains shown in (C). Independent cultures (n = 3 per genotype) were grown at log phase for 24 h in CSM -Ura liquid media, fixed, and analyzed. Representative flow cytometry profiles for each strain are shown. Quadrants were established by using the fluorescence profiles of SIR2 and sir2Δ cells (Supplementary Figure S6). (E) Fraction of GFP+ cells in independent cultures grown in (D). Data are means ± SD (n = 3 independent cultures per genotype). A two-tailed t-test was used for statistical analysis.
Figure 5
Figure 5
Changes in rDNA copy number were partially responsible for silencing variegation in sir2-G436D. (A) Representative colony images of SIR2 (JRY12860), SIR2, fob1Δ (JRY12899), sir2-G436D (JRY12564), and sir2-G436D, fob1Δ (JRY12901). Six colonies are shown for each strain with sir2-G436D. Colonies were grown on CSM. Scale bar, 3 mm. (B) Flow cytometry profiles of same strains shown in (A). Independent cultures (n = 3 per genotype) were grown at log phase for 24 h in CSM liquid media, fixed, and analyzed. A representative flow cytometry flow profile for each strain is shown. (C) Fraction of GFP+ cells in independent cultures grown in (B). Data are means ± SD (n = 3 independent cultures per genotype). A two-tailed t-test was used for statistical analysis. (D) The rate of silencing loss per generation, which represented the frequency at which a GFP- cell switched to GFP+ per cell division, as calculated by monitoring cell divisions by live-cell microscopy (n > 500 cell divisions per genotype). Error bars represent 95% confidence intervals, and statistical analysis was performed by using a Yates chi-square test. (E) The rate of silencing establishment per generation, which represented the frequency at which a GFP+ cell switched to GFP- per cell division, as calculated by monitoring cell divisions by live-cell microscopy (n > 400 cell divisions per genotype). Error bars represent 95% confidence intervals, and statistical analysis was performed by using a Yates chi-square test.
Figure 6
Figure 6
sir2-G436D lacks the ability to repress rDNA recombination. (A) Representative colony images of strains containing RDN37::GFP (JRY13204-13208), grown on CSM. Three colonies are shown for each genotype. GFP sectors represent events in which rDNA recombination yielded a loss of GFP, and sectors with stronger GFP signal represent events in which rDNA recombination likely yielded a duplication of GFP. Scale bar, 2 mm. (B) Quantification of half-sector frequency for strains containing RDN37::GFP (JRY13204-13208), as described in Materials and Methods. Each circle represents the frequency of half-sector colonies in an independent experiment, and lines represent the means of both experiments. At least 7000 GFP+ colonies were analyzed per genotype.

References

    1. Bähler J, Wu J-Q, Longtine MS, Shah NG, Mckenzie A III, et al.1998. Heterologous modules for efficient and versatile PCR‐based gene targeting in Schizosaccharomyces pombe. Yeast 14:943–951. - PubMed
    1. Brothers M, Rine J.. 2019. Mutations in the PCNA DNA polymerase clamp of Saccharomyces cerevisiae reveal complexities of the cell cycle and ploidy on heterochromatin assembly. Genetics 213:449–463. - PMC - PubMed
    1. Chien CT, Buck S, Sternglanz R, Shore D.. 1993. Targeting of SIR1 protein establishes transcriptional silencing at HM loci and telomeres in yeast. Cell 75:531–541. - PubMed
    1. Dhillon N, Kamakaka RT.. 2000. A Histone Variant, Htz1p, and a Sir1p-like Protein, Esc2p, Mediate Silencing at HMR. Mol Cell 6:769–780. - PubMed
    1. Dodson AE, Rine J.. 2015. Heritable capture of heterochromatin dynamics in Saccharomyces cerevisiae. Elife 4:e05007. - PMC - PubMed

Publication types

MeSH terms

Substances

LinkOut - more resources