. 2021 Mar 13;13(7):9186-9224.
doi: 10.18632/aging.202735. Epub 2021 Mar 13.

A COVID-19 risk score combining chest CT radiomics and clinical characteristics to differentiate COVID-19 pneumonia from other viral pneumonias

Affiliations

A COVID-19 risk score combining chest CT radiomics and clinical characteristics to differentiate COVID-19 pneumonia from other viral pneumonias

Zuhua Chen et al. Aging (Albany NY). .

Abstract

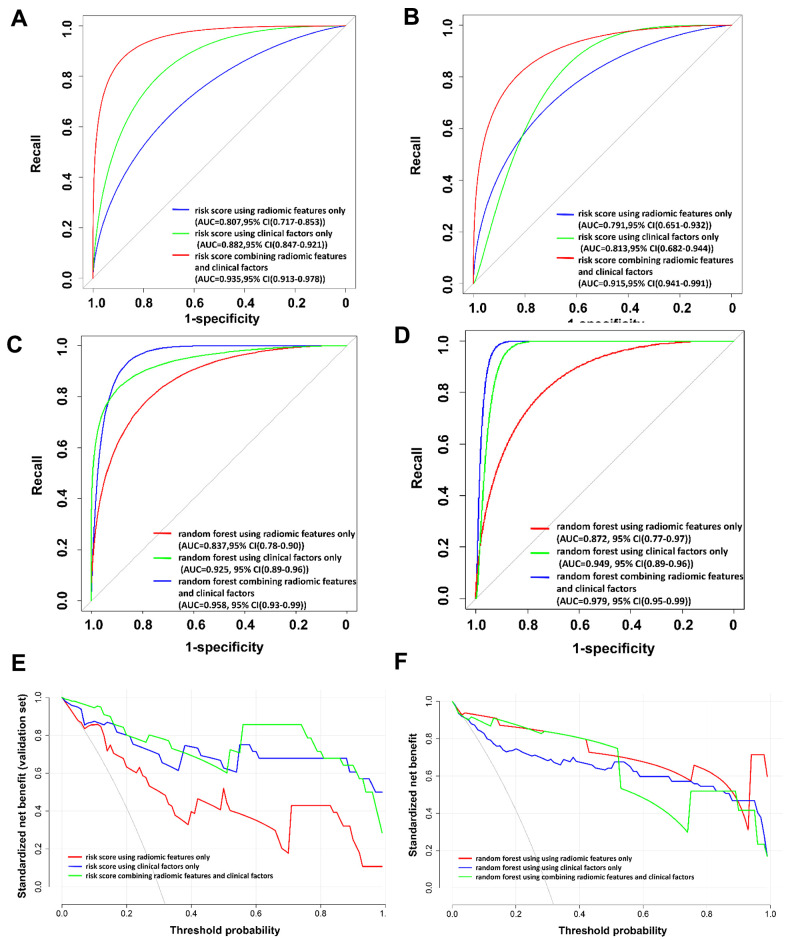
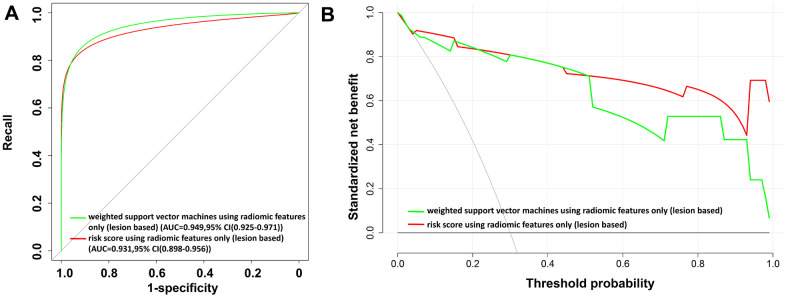
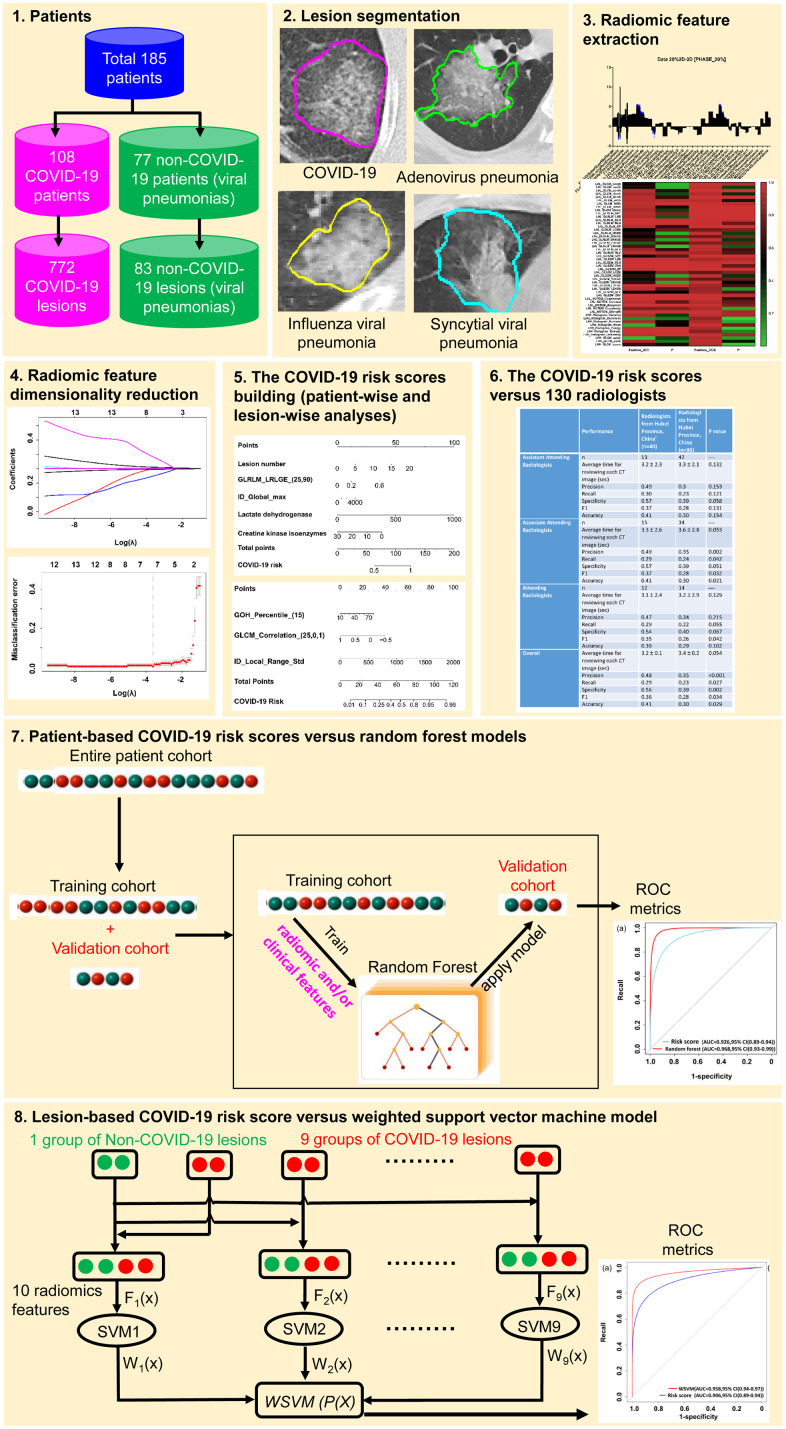
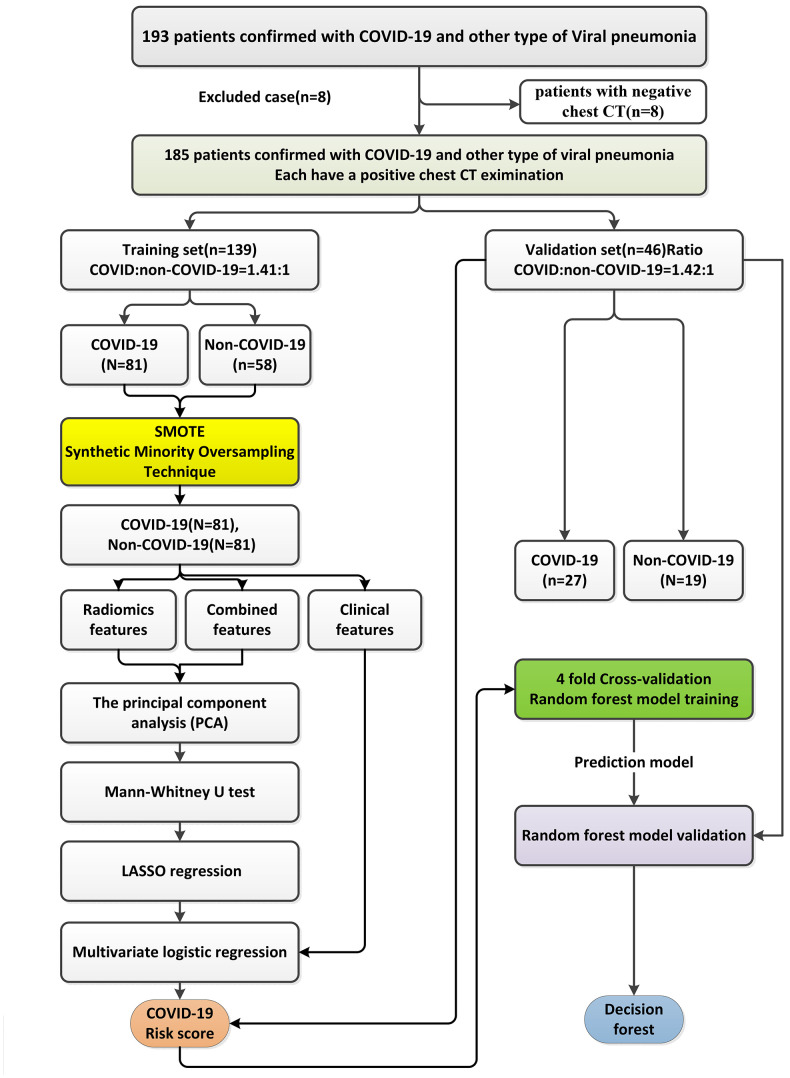
With the continued transmission of severe acute respiratory syndrome coronavirus 2 (SARS-CoV-2) throughout the world, identification of highly suspected COVID-19 patients remains an urgent priority. In this study, we developed and validated COVID-19 risk scores to identify patients with COVID-19. In this study, for patient-wise analysis, three signatures, including the risk score using radiomic features only, the risk score using clinical factors only, and the risk score combining radiomic features and clinical variables, show an excellent performance in differentiating COVID-19 from other viral-induced pneumonias in the validation set. For lesion-wise analysis, the risk score using three radiomic features only also achieved an excellent AUC value. In contrast, the performance of 130 radiologists based on the chest CT images alone without the clinical characteristics included was moderate as compared to the risk scores developed. The risk scores depicting the correlation of CT radiomics and clinical factors with COVID-19 could be used to accurately identify patients with COVID-19, which would have clinically translatable diagnostic and therapeutic implications from a precision medicine perspective.

Keywords: COVID-19; chest CT; coronavirus disease 2019; nomogram; radiomics; severe acute respiratory syndrome coronavirus 2.


Conflict of interest statement

CONFLICTS OF INTEREST: We declare no conflicts of interest.

Figures

Figure 1
Figure 1
Representative images of COVID-19 pneumonia, adenovirus pneumonia, cytomegalovirus pneumonia, and influenza virus pneumonia. (A) A transverse CT image from a 35-year-old man with adenovirus pneumonia showing bilateral ground-glass opacities in the upper lobes with a rounded morphology (arrows). (B) COVID-19: A transverse CT image from a 57-year-old man with COVID-19 showing more limited ground-glass opacities in the bilateral upper lobes with an elliptical morphology (arrows). (C) A transverse CT image obtained in a 45-year-old female with cytomegalovirus pneumonia showing bilateral ground-glass and burr-like, denser, and less transparent distribution (arrows). (D) A transverse CT image of a 61-year-old man diagnosed with influenza virus pneumonia showing bilateral ground-glass opacities in the upper lobes (arrows).
Figure 2
Figure 2
The patient-based COVID-19 risk scores demonstrated by nomograms. (A) The risk score using radiomic features only. (B) The risk score using clinical factors only. (C) The risk score combining radiomic features and clinical factors. GLRLM_LRLGE_(25, 90) represents the radiomic feature long run low gray-level emphasis, which describes the distribution of the long homogeneous runs with low gray-levels within the image. The numbers in the bracket represents the parameters used to calculate that particular radiomic feature. The parameters of 25 and 90 in GLRLM_LRLGE represent the binary mask in 2.5D and 90 degrees, which describes that the GLRLM was computed in 2D slice by slice; then, the occurrence of run length from 90 degrees from all 2D image slices was summed. ID_Global_max represents the radiomic feature intensity direct global max, which describes that the binary mask was preprocessed for the features derived directly from the image intensity. The binary mask in ID_Global_max can be modified through intensity thresholding, by binary erosion, and using only the binary slice with the maximum area. The unit for lactate dehydrogenase is U/L. The unit for creatine kinase isoenzymes is μg/L. Supplementary Appendix 2 explains how to use the nomograms.
Figure 3
Figure 3
The receiver operating characteristic (ROC) curves and the decision curve analysis (DCA) for the patient-based risk scores and random forest models. (A) ROC curve for patient-based risk scores in the training set. (B) ROC curve for patient-based risk scores in the validation set. (C) ROC curve for patient-based random forest models in the training set. (D) ROC curve for patient-based random forest models in the validation set. (E) DCA for patient-based risk scores in the validation set. (F) DCA for patient-based random forest models in the validation set. In (E) and (F), the x-axis of the decision curve is the threshold of the predicted probability using the risk score to classify COVID-19 and non-COVID-19 patients. The y-axis shows the clinical decision net benefit for patients based on the classification result in this threshold. The decision curves of the treat-all scheme (the monotonically decreasing dash-line curve in the figure) and the treat-none scheme (the line when x equals zero) are used as references in the DCA. In this study, the treat-all scheme assumes that all the patients had COVID-19; the treat-none scheme assumes that none of the patients had COVID-19. Abbreviations: AUC, area under the ROC curve; 95% CI, 95% confidence interval.
Figure 4
Figure 4
The lesion-based risk score using three radiomic features only. GOH_Percentile_(15) represents the radiomic feature gradient orient histogram, which describes the percentiles of the occurrence probability values in the histogram of the image. The numbers in the brackets represent the parameters used to calculate that particular radiomic feature. The parameter of 15 in GOH_Percentile represents the histogram percentile. GLCM_Correlation_(25,0,1) represents the radiomic feature gray-level co-occurrence matrix with statistical measurement of correlation between a pixel and its neighbor over the whole image, which describes that the gray-level co-occurrence matrix was computed from the image inside the binary mask in 2.5D with the direction of the angle of intensity pair at 0 degrees and the distance between the intensity pairs at 1. ID-Local_Range_Std represents the intensity direct in the neighborhood region, which describes the standard deviation among all the voxels.
Figure 5
Figure 5
The receiver operating characteristic (ROC) curves and the decision curve analysis (DCA) for the lesion-based risk score and weighted support vector machine model using radiomic features alone. (A) ROC curve. (B) DCA analysis. In (B), the x-axis of the decision curve is the threshold of the predicted probability using the risk score to classify COVID-19 and non-COVID-19 patients. The y-axis shows the clinical decision net benefit for patients based on the classification result in this threshold. The decision curves of the treat-all scheme (the monotonically decreasing dash-line curve in the figure) and the treat-none scheme (the line when x equals zero) are used as references in the DCA. In this study, the treat-all scheme assumes that all patients had COVID-19; the treat-none scheme assumes that none of the patients had COVID-19. Abbreviations: AUC, area under the curve; 95% CI, 95% confidence interval.
Figure 6
Figure 6
The workflow for the development and validation of COVID-19 risk scores.
Figure 7
Figure 7
The workflow of the construction of the patient-based risk scores using radiomic features only, the risk score using clinical factors only, and the risk score combining radiomic features and clinical variables using a multivariate logistic regression method and a random forest model.

Similar articles

Cited by

References

    1. Zhou F, Yu T, Du R, Fan G, Liu Y, Liu Z, Xiang J, Wang Y, Song B, Gu X, Guan L, Wei Y, Li H, et al.. Clinical course and risk factors for mortality of adult inpatients with COVID-19 in Wuhan, China: a retrospective cohort study. Lancet. 2020; 395:1054–62. 10.1016/S0140-6736(20)30566-3 - DOI - PMC - PubMed
    1. Johns Hopkins University of Medicine. Coronavirus Resource Center. https://coronavirus.jhu.edu/
    1. Wölfel R, Corman VM, Guggemos W, Seilmaier M, Zange S, Müller MA, Niemeyer D, Jones TC, Vollmar P, Rothe C, Hoelscher M, Bleicker T, Brünink S, et al.. Virological assessment of hospitalized patients with COVID-2019. Nature. 2020; 581:465–69. 10.1038/s41586-020-2196-x - DOI - PubMed
    1. Fang Y, Zhang H, Xie J, Lin M, Ying L, Pang P, Ji W. Sensitivity of chest CT for COVID-19: comparison to RT-PCR. Radiology. 2020; 296:E115–17. 10.1148/radiol.2020200432 - DOI - PMC - PubMed
    1. Nevens D, Billiet C, Weytjens R, Joye I, Machiels M, Vermylen A, Chiari I, Bauwens W, Vermeulen P, Dirix L, Huget P, Verellen D, Dirix P, Meijnders P. The use of simulation-CT’s as a coronavirus disease 2019 screening tool during the severe acute respiratory syndrome coronavirus 2 pandemic. Radiother Oncol. 2020; 151:17–19. 10.1016/j.radonc.2020.07.006 - DOI - PMC - PubMed

Publication types