

Nanoparticle formulation of mycophenolate mofetil achieves enhanced efficacy against hepatocellular carcinoma by targeting tumour-associated fibroblast
- PMID: 33713546
- PMCID: PMC8034467
- DOI: 10.1111/jcmm.16434
Nanoparticle formulation of mycophenolate mofetil achieves enhanced efficacy against hepatocellular carcinoma by targeting tumour-associated fibroblast
Abstract
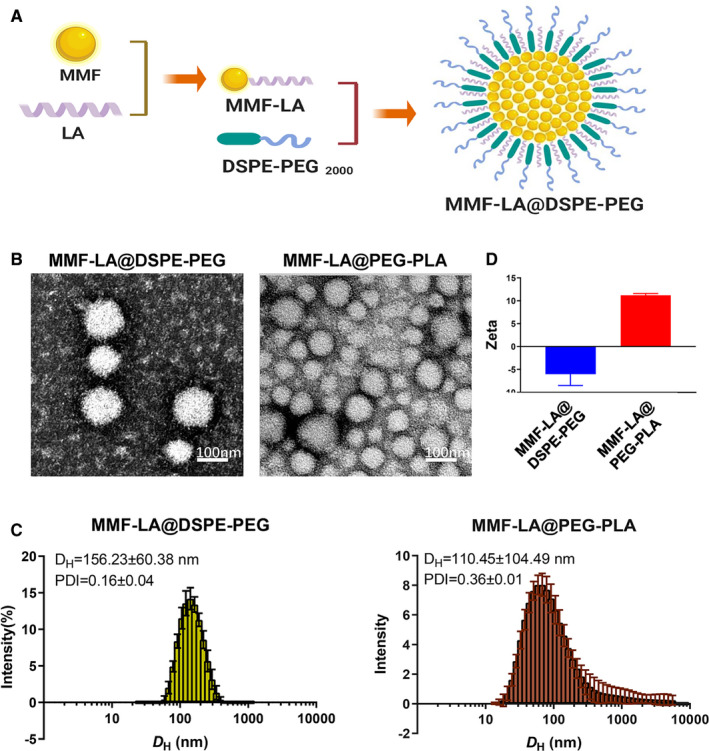
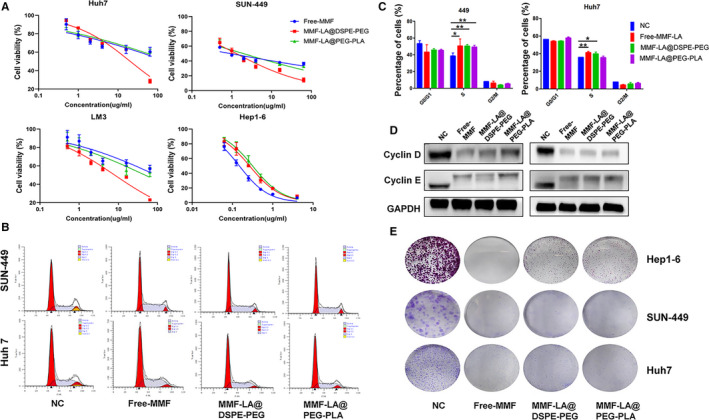
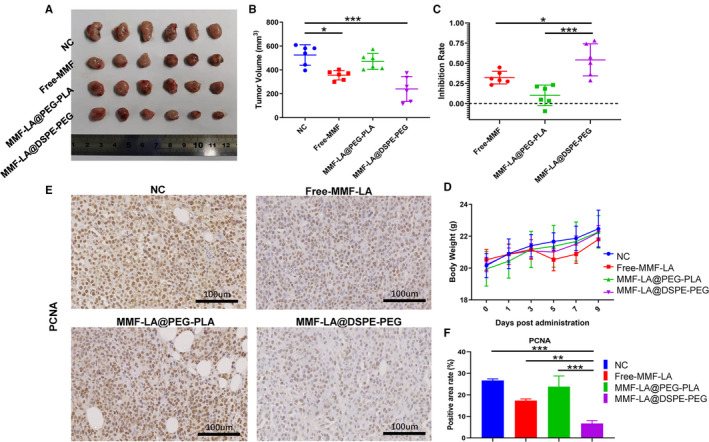
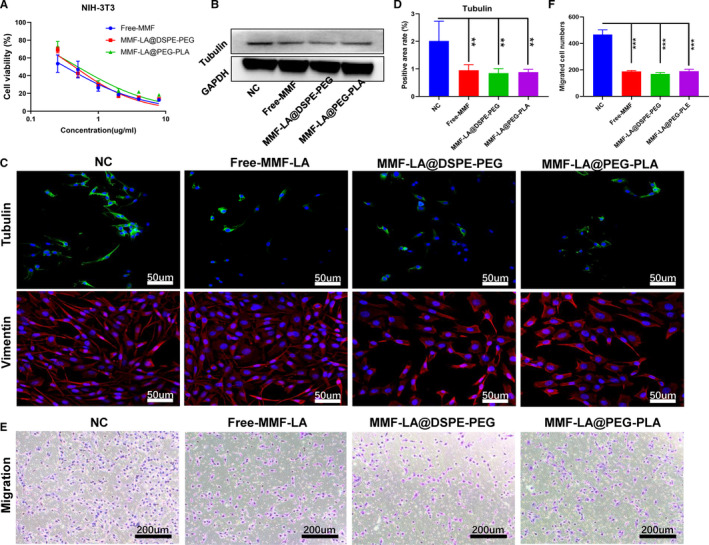
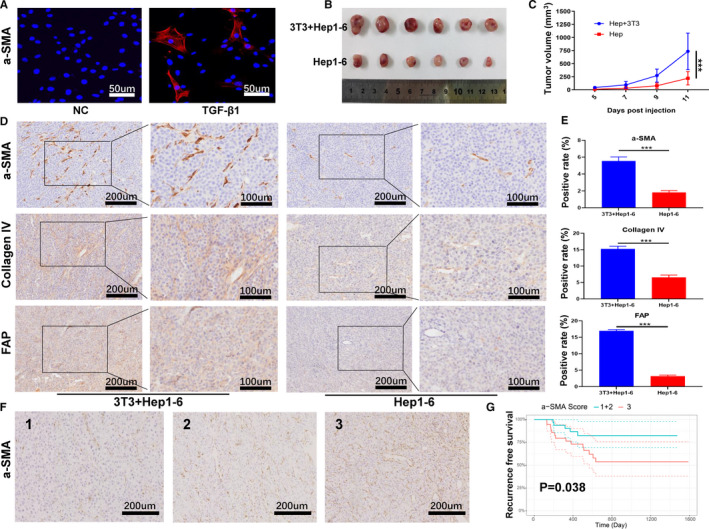
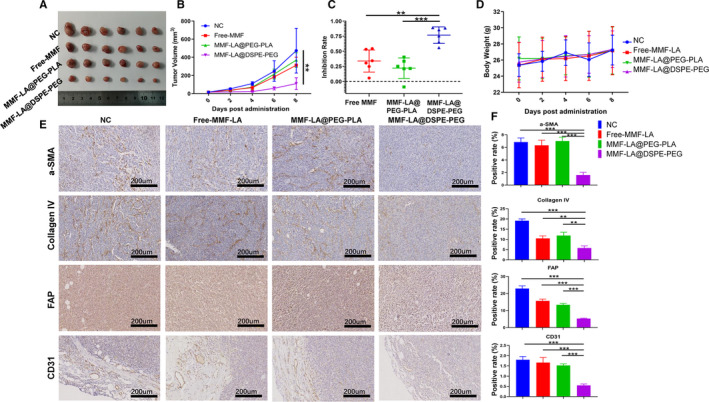
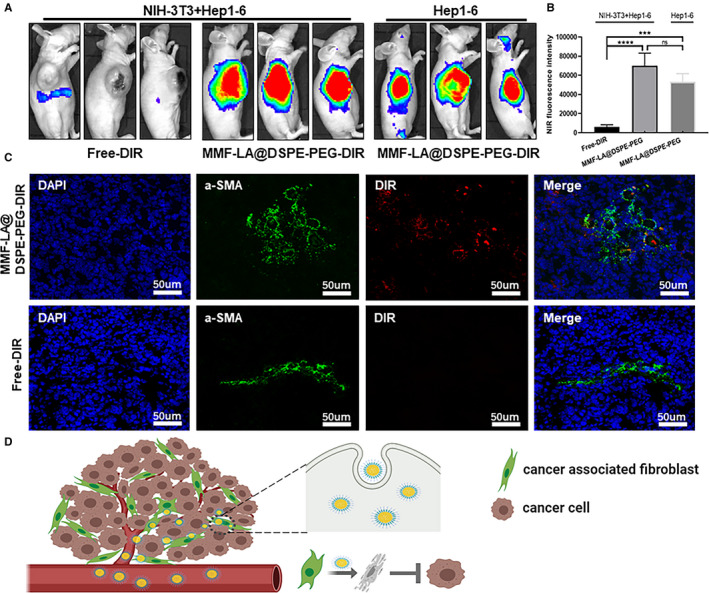
Hepatocellular carcinoma (HCC) is one of the most aggressive tumours with marked fibrosis. Mycophenolate mofetil (MMF) was well-established to have antitumour and anti-fibrotic properties. To overcome the poor bioavailability of MMF, this study constructed two MMF nanosystems, MMF-LA@DSPE-PEG and MMF-LA@PEG-PLA, by covalently conjugating linoleic acid (LA) to MMF and then loading the conjugate into polymer materials, PEG5k -PLA8k and DSPE- PEG2k , respectively. Hepatocellular carcinoma cell lines and C57BL/6 xenograft model were used to examine the anti-HCC efficacy of nanoparticles (NPs), whereas NIH-3T3 fibroblasts and highly-fibrotic HCC models were used to explore the anti-fibrotic efficacy. Administration of NPs dramatically inhibited the proliferation of HCC cells and fibroblasts in vitro. Animal experiments revealed that MMF-LA@DSPE-PEG achieved significantly higher anti-HCC efficacy than free MMF and MMF-LA@PEG-PLA both in C57BL/6 HCC model and highly-fibrotic HCC models. Immunohistochemistry further confirmed that MMF-LA@DSPE-PEG dramatically reduced cancer-associated fibroblast (CAF) density in tumours, as the expression levels of alpha-smooth muscle actin (α-SMA), fibroblast activation protein (FAP) and collagen IV were significantly downregulated. In addition, we found the presence of CAF strongly correlated with increased HCC recurrence risk after liver transplantation. MMF-LA@DSPE-PEG might act as a rational therapeutic strategy in treating HCC and preventing post-transplant HCC recurrence.
Keywords: cancer-associated fibroblast; hepatocellular carcinoma; mycophenolate mofetil; nanoparticles.
© 2021 The Authors. Journal of Cellular and Molecular Medicine published by Foundation for Cellular and Molecular Medicine and John Wiley & Sons Ltd.
Conflict of interest statement
The authors confirm that there are no conflicts of interest.
Figures
Similar articles
-
Co-delivery of sorafenib and metapristone encapsulated by CXCR4-targeted PLGA-PEG nanoparticles overcomes hepatocellular carcinoma resistance to sorafenib.J Exp Clin Cancer Res. 2019 May 31;38(1):232. doi: 10.1186/s13046-019-1216-x. J Exp Clin Cancer Res. 2019. PMID: 31151472 Free PMC article.
-
Salinomycin-Loaded Small-Molecule Nanoprodrugs Enhance Anticancer Activity in Hepatocellular Carcinoma.Int J Nanomedicine. 2020 Sep 15;15:6839-6854. doi: 10.2147/IJN.S236928. eCollection 2020. Int J Nanomedicine. 2020. PMID: 32982236 Free PMC article.
-
Targeted delivery of microRNA-199a-3p using self-assembled dipeptide nanoparticles efficiently reduces hepatocellular carcinoma in mice.Hepatology. 2018 Apr;67(4):1392-1407. doi: 10.1002/hep.29643. Epub 2018 Feb 22. Hepatology. 2018. PMID: 29108133
-
New molecular targets for functionalized nanosized drug delivery systems in personalized therapy for hepatocellular carcinoma.J Control Release. 2017 Dec 28;268:184-197. doi: 10.1016/j.jconrel.2017.10.027. Epub 2017 Oct 16. J Control Release. 2017. PMID: 29051062 Review.
-
Nanomedicine as a putative approach for active targeting of hepatocellular carcinoma.Semin Cancer Biol. 2021 Feb;69:91-99. doi: 10.1016/j.semcancer.2019.08.016. Epub 2019 Aug 14. Semin Cancer Biol. 2021. PMID: 31421265 Review.
Cited by
-
The Role and Application of Fibroblast Activating Protein.Curr Mol Med. 2024;24(9):1097-1110. doi: 10.2174/1566524023666230530095305. Curr Mol Med. 2024. PMID: 37259211 Review.
-
Perspectives on Mycophenolate Mofetil in the Management of Autoimmunity.Clin Rev Allergy Immunol. 2023 Aug;65(1):86-100. doi: 10.1007/s12016-023-08963-3. Epub 2023 Jun 20. Clin Rev Allergy Immunol. 2023. PMID: 37338709 Review.
-
SERPINE2 promotes liver cancer metastasis by inhibiting c-Cbl-mediated EGFR ubiquitination and degradation.Cancer Commun (Lond). 2024 Mar;44(3):384-407. doi: 10.1002/cac2.12527. Epub 2024 Feb 26. Cancer Commun (Lond). 2024. PMID: 38407942 Free PMC article.
-
Small molecule inhibitors for cancer metabolism: promising prospects to be explored.J Cancer Res Clin Oncol. 2023 Aug;149(10):8051-8076. doi: 10.1007/s00432-022-04501-4. Epub 2023 Mar 31. J Cancer Res Clin Oncol. 2023. PMID: 37002510 Free PMC article. Review.
-
Nano-Drug Delivery Systems Targeting CAFs: A Promising Treatment for Pancreatic Cancer.Int J Nanomedicine. 2024 Mar 18;19:2823-2849. doi: 10.2147/IJN.S451151. eCollection 2024. Int J Nanomedicine. 2024. PMID: 38525013 Free PMC article. Review.
References
-
- Villanueva A. Hepatocellular carcinoma. N Engl J Med. 2019;380(15):1450‐1462. - PubMed
-
- Ruan QI, Wang H, Burke LJ, et al. Therapeutic modulators of hepatic stellate cells for hepatocellular carcinoma. Int J Cancer. 2020;147(6):1519–1527. - PubMed
-
- Ezhilarasan D, Sokal E, Najimi M. Hepatic fibrosis: it is time to go with hepatic stellate cell‐specific therapeutic targets. Hepatobiliary Pancreat Dis Int. 2018;17(3):192‐197. - PubMed
Publication types
MeSH terms
Substances
Grants and funding
LinkOut - more resources
Full Text Sources
Other Literature Sources
Miscellaneous
