. 2021 May 20;81(10):2135-2147.e5.
doi: 10.1016/j.molcel.2021.02.036. Epub 2021 Mar 3.

The SARS-CoV-2 subgenome landscape and its novel regulatory features

Affiliations

The SARS-CoV-2 subgenome landscape and its novel regulatory features

Dehe Wang et al. Mol Cell. .

Abstract

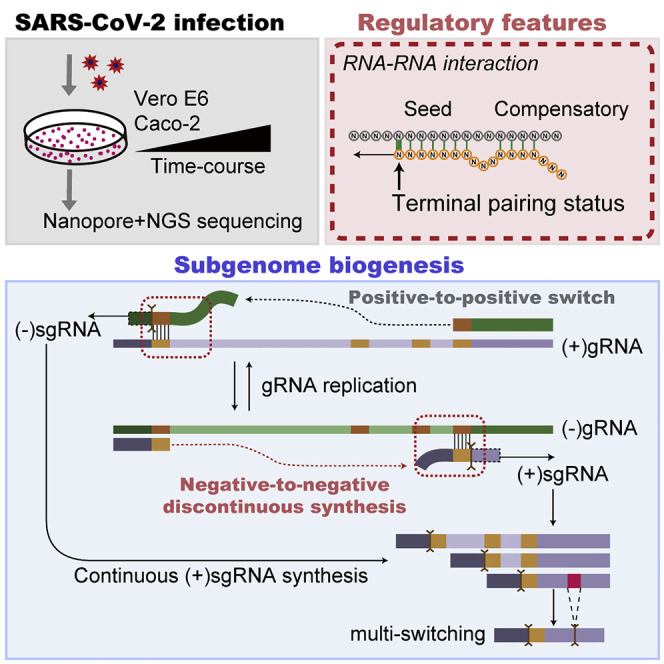
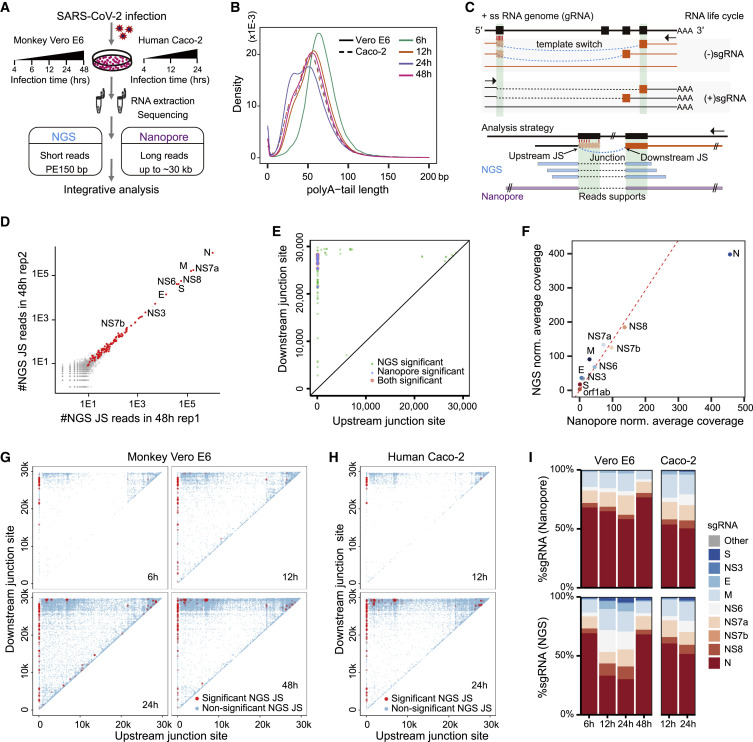
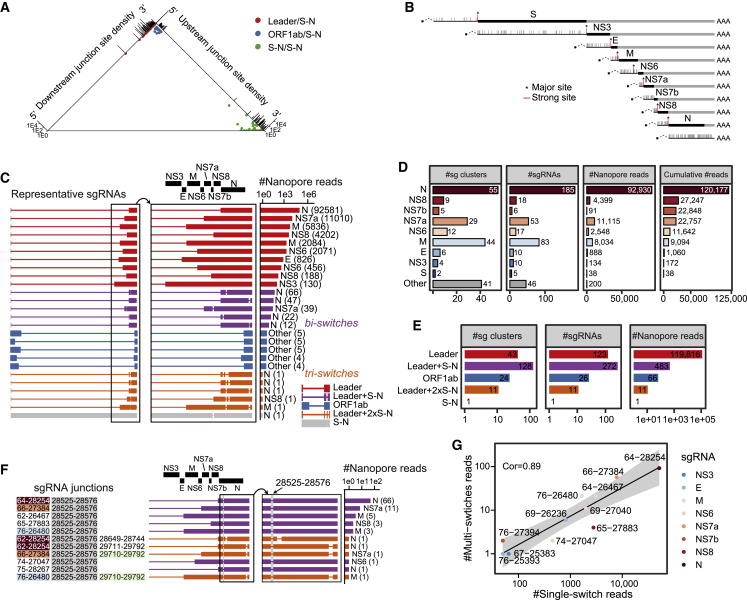
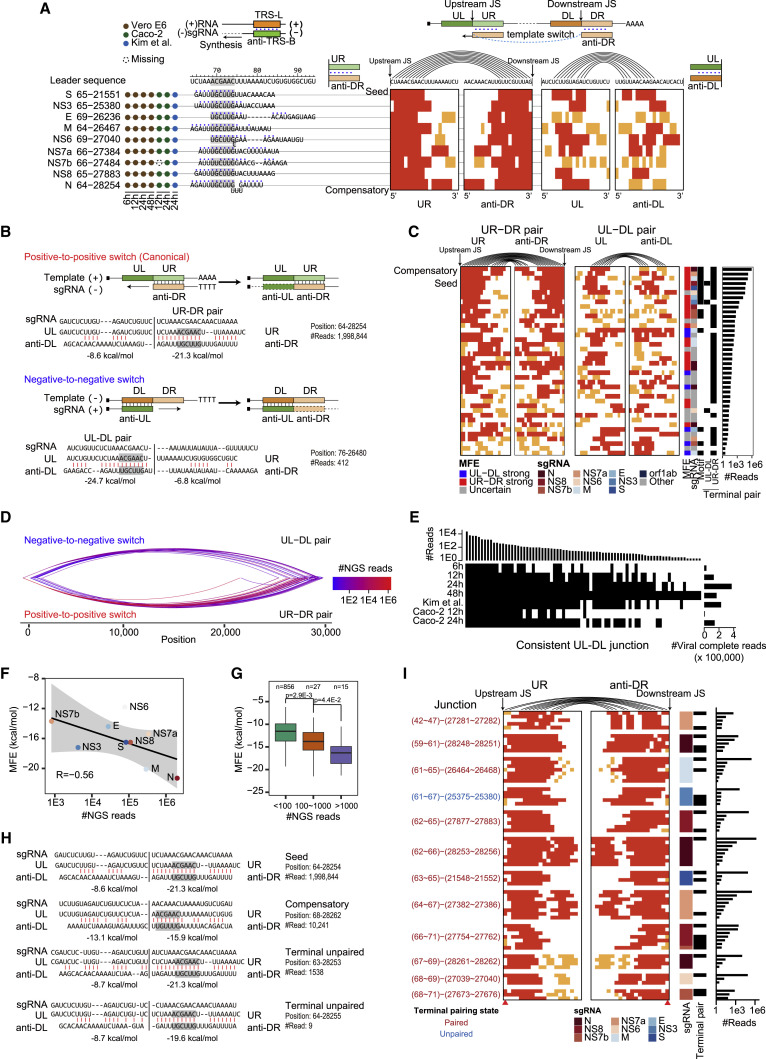
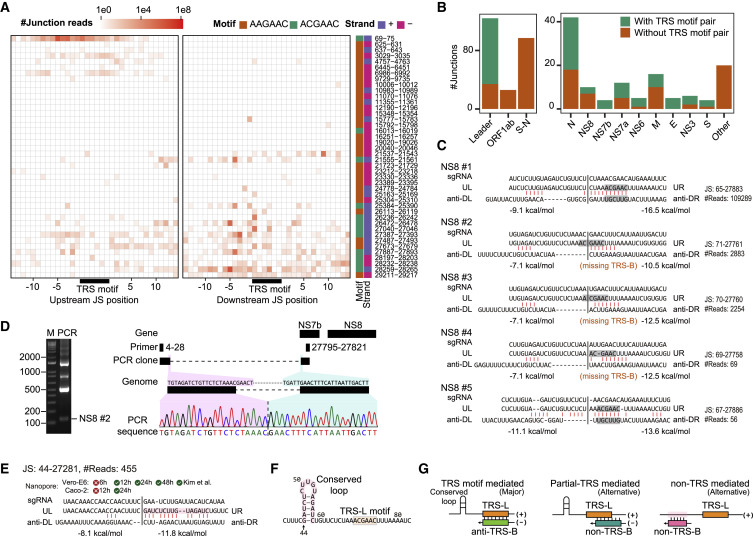
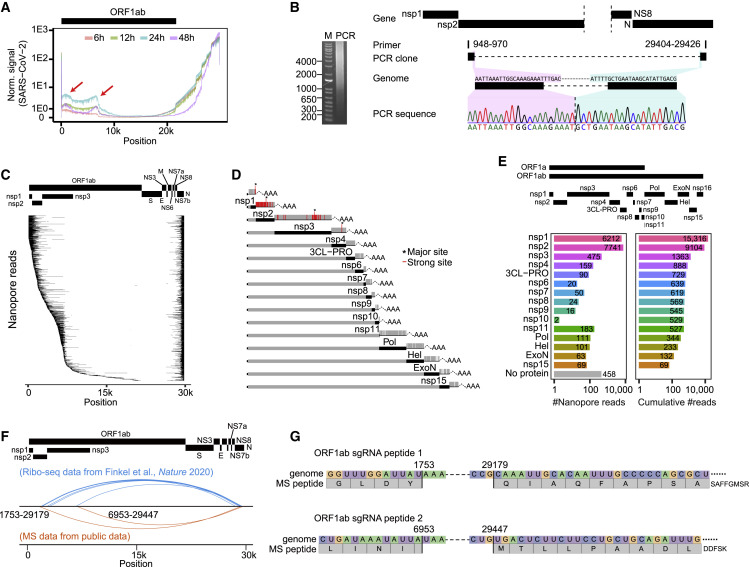
Coronavirus disease 2019 (COVID-19), caused by severe acute respiratory syndrome coronavirus 2 (SARS-CoV-2), is currently a global pandemic. CoVs are known to generate negative subgenomes (subgenomic RNAs [sgRNAs]) through transcription-regulating sequence (TRS)-dependent template switching, but the global dynamic landscapes of coronaviral subgenomes and regulatory rules remain unclear. Here, using next-generation sequencing (NGS) short-read and Nanopore long-read poly(A) RNA sequencing in two cell types at multiple time points after infection with SARS-CoV-2, we identified hundreds of template switches and constructed the dynamic landscapes of SARS-CoV-2 subgenomes. Interestingly, template switching could occur in a bidirectional manner, with diverse SARS-CoV-2 subgenomes generated from successive template-switching events. The majority of template switches result from RNA-RNA interactions, including seed and compensatory modes, with terminal pairing status as a key determinant. Two TRS-independent template switch modes are also responsible for subgenome biogenesis. Our findings reveal the subgenome landscape of SARS-CoV-2 and its regulatory features, providing a molecular basis for understanding subgenome biogenesis and developing novel anti-viral strategies.

Keywords: COVID-19; Nanopore sequencing; RNA pairing; SARS-CoV-2; biogenesis; coronavirus; sgRNA; subgenome; template switch.


Conflict of interest statement

Declaration of interests The authors declare no competing interests.

Figures

None
Graphical abstract
Figure 1
Figure 1
Experimental strategy and analysis for global mapping of template switches (A) Experimental design for decoding SARS-CoV-2 subgenome dynamics at different time points after infection of Vero E6 and Caco-2 cells. (B) Distribution of poly(A) tail length in Nanopore reads in different samples. (C) SARS-CoV-2 RNA genome life cycle and the analysis strategy. The template switches are represented by curved dashed lines and identified by junctions in NGS and Nanopore reads. (D) Reproducibility of two replicates of NGS data. Each dot represents the read counts of one junction in replicates 1 (x axis) and 2 (y axis). Red points represent the significant junctions identified by statistical analysis. (E) Global view of NGS-consistent and Nanopore-consistent JSs in Vero E6 cells 48 h after infection. Each dot represents a junction linking the start (x axis) and end genomic position (y axis). NGS-only, Nanopore-only, and both consistent JSs are represented in green, blue, and red, respectively. (F) Comparison of the signal coverage for each type of sgRNA between Nanopore and NGS platforms in Vero E6 cells 48 h after infection. (G) Global view of NGS-derived JSs in VeroE6 cells infected with SARS-CoV-2 at 6 h, 12 h, 24 h, and 48 h. Red points represent statistically significant JSs. (H) Same as (G) for Caco-2 data at 12 h and 24 h. (I) Statistics of sgRNA composition in different samples based on Nanopore (top) and NGS (bottom) reads. See also Figures S1 and S2.
Figure 2
Figure 2
Global landscape of SARS-CoV-2 subgenomes (A) Global view of consistent template switches in NGS and Nanopore data. Each template switch is represented as a point by the genomic positions of its upstream and downstream JSs in the genome. Three types of template switches are shown in different colors (leader/S-N, red; ORF1ab/S-N, blue; S-N/S-N, green). The densities of upstream and downstream JSs are shown in the top right and top left bar graphs, respectively. (B) Distribution of the downstream JSs for leader-group sgRNAs (48 h, Vero E6 cells). The sgRNA names were assigned based on the first annotated gene downstream of the junction. Strong sites (with more than 100 NGS read support) are marked as red lines, of which the major site (with the largest number) in each sgRNA group is marked with an asterisk. (C) Subgenome clusters reconstructed from Nanopore long reads. Representative examples of five different types of subgenomes (colored legend) are shown by row in global (left) and magnified (center) views with the number of supporting reads (right). Boxes and lines represent transcribed and skipped regions, respectively, because of template switches. The top 10 leader-type and top 5 other types of subgenomes are shown. The label of the subgenome was assigned by the first ORF after the template switch. (D) Statistics for 10 subgenome types classified by the first complete ORF in the subgenome (Vero E6 cells, 48 h). For each type of sgRNA, the number of clusters, sgRNAs, Nanopore reads, and cumulative count of Nanopore reads containing the ORF are shown. Because S sgRNAs are the longest canonical sgRNAs, they might be sequenced less efficiently by Nanopore. (E) The number of subgenome clusters, subgenomes, and subgenome reads for five types of subgenomes. (F) Examples of multi-switch sgRNAs with common junctions (28,525–28,576). There are 7 bi-switch and 4 tri-switch sgRNAs (numbers of supporting Nanopore reads are shown on the right). (G) Comparison of the number of multi-switch reads versus single-switch reads with a specific junction for leader-type sgRNAs. The Spearman correlation coefficient is labeled. See also Figures S3 and S4.
Figure 3
Figure 3
RNA-RNA pairing determinants in template switching efficacy (A) The RNA-RNA base-pairing patterns for the 9 canonical SARS-CoV-2 sgRNAs. The presence/absence of sgRNAs in 7 Nanopore samples (by column) are shown on the left with filled circles or an empty circle (NS7b sgRNA). Base pairings between the TRS-L and anti-TRS-B segments are represented by blue dots, and the TRS motifs are highlighted in gray. The heatmaps on the right represent base pairings between the UR-DR pair (UR and anti-DR) and UL-DL pair (UL and anti-DL). The red or orange squares represent paired states, whereas white squares represent an unpaired state for base pairings between two specific segments flanking the upstream and downstream JSs for template-switching events by row, as illustrated by the arcs linking the predicted base pairs for the first row of template switches (S sgRNA). Red indicates a consecutive paired state in a 6-nt segment with at least 5 nt. (B) Illustrations and examples of the positive-to-positive (top, UR-DR pair, canonical) and negative-to-negative (bottom, UL-DL pair) template switch modes. Known TRS motifs are highlighted in a gray box. The number of NGS reads in 48-h Vero E6 cell data and the MFEs between different pairing segments are shown. (C) Heatmaps as in (A), representing RNA-RNA base pairings in two modes (UR-DR pair and UL-DL pair) for consistent and core template switch junctions from Vero E6 cell 48-h data. The junctions shown by row are detected in NGS and Nanopore reads, with the largest numbers of read support in 5-nt windows from the leader-type sgRNAs. The rows are sorted by the number of supporting NGS reads. (D) Global view of negative-to-negative (top) and positive-to-positive (bottom) template switches for consistent junctions in NGS and Nanopore data 48 h after infection. The numbers of supporting NGS reads are shown by color-scaled lines. (E) Consistent UL-DL junctions observed in Nanopore reads from different samples. The junctions are ordered by column according to their total number of reads in all 7 samples (top). The presence of junctions in each sample (by row) is represented by black rectangles. The total numbers of complete Nanopore reads for all samples are shown on the right. (F) The relationship between the MFE and the number of NGS reads for 9 major leader-group sgRNA junctions (48 h, Vero E6 cells). The Spearman correlation coefficient is labeled. (G) Boxplots of MFEs for leader-group sgRNA junctions sub-grouped by the number of NGS reads (48 h, Vero E6 cells). The number of junctions in each group and the p values from one-sided t tests are shown at the top. (H) Representative examples showing that RRI features affect template switching efficacy. The RNA base-pairing pattern, MFE, terminal paired/unpaired status, and number of observed reads are shown for each example. (I) RNA-RNA base-pairing visualization as in (A) between UR and anti-DR segments flanking template switch sites. The columns indicating the pairing states of the two terminal bases are marked by red arrows. Neighboring junctions with similar pairing patterns were grouped together, and the terminal pairing states for the major junctions in each group was marked by color (red for paired and blue for unpaired). The corresponding sgRNA, terminal pairing state, and read numbers (48 h, Vero E6 cells) for each junction are shown by row on the right. See also Figures S5 and S6.
Figure 4
Figure 4
TRS motif-independent RRI in template switch (A) Heatmap showing use of TRS motifs in donor and acceptor sites of template switches. The motif sequences, strands, and genomic positions are annotated on the right side. (B) Proportion of TRS-mediated template switches in different types of subgenomes. (C) Representative template switch examples without TRS motifs. The TRS motif is marked in gray, and the number of junction reads detected for each class of NS8 is shown. (D) RT-PCR validation for NS8 #2 sgRNA by clone sequencing. The locations of primers, genome sequences, and cloned sequences are shown on the right. (E) An example of upstream, non-TRS mediated, leader-type sgRNA. The number of NGS reads for Vero E6 48 h cells is shown. The presence of this sgRNA in Nanopore data from different samples is marked. (F) Illustration of the non-TRS sequence (pink) in a conserved loop for non-TRS mediated leader-type sgRNA in (E). (G) Illustration of three types of pairing models mediating template switches for leader-type sgRNAs.
Figure 5
Figure 5
Extensive fusion subgenomes between ORF1ab and the N RNA region (A) Nanopore read coverage profiles across the SARS-CoV-2 genome for different time points after infection of Vero E6 cells. The arrows in the ORF1ab region mark two obvious loci with abrupt changes indicating template switch junctions. (B) RT-PCR validation for ORF1ab sgRNA by clone sequencing. The diffusing band indicates diverse types of junctions between the two primers. The locations of primers, genome sequences, and cloned sequences are shown on the right. (C) Global view of Nanopore reads associated with ORF1ab-mediated long-range template switches (Vero E6 cells, 48 h). (D) Distribution of the upstream JS for ORF1ab sgRNAs (Vero E6 cells, 48 h). The sgRNA types were assigned according to the last protein upstream of the junction in ORF1ab. Strong sites are shown as a red line, whereas major sites are marked by asterisks. (E) Counts (left) and cumulative counts (right) of Nanopore reads assigned to the 16 types of ORF1ab sgRNAs (Vero E6 cells, 48 h). (F) Illustration of ORF1ab-type JSs covered by the SARS-CoV-2 Ribo-seq reads (blue curves) and MS peptides (orange curves). (G) Examples of ORF1ab-type sgRNA-derived peptides spanning the sgRNA junctions from MS data. See also Figure S7.

Similar articles

Cited by

References

    1. Bartel D.P. Metazoan MicroRNAs. Cell. 2018;173:20–51. - PMC - PubMed
    1. Chen L., Liu W., Zhang Q., Xu K., Ye G., Wu W., Sun Z., Liu F., Wu K., Zhong B. RNA based mNGS approach identifies a novel human coronavirus from two individual pneumonia cases in 2019 Wuhan outbreak. Emerg. Microbes Infect. 2020;9:313–319. - PMC - PubMed
    1. Chen Y., Liu Q., Guo D. Emerging coronaviruses: Genome structure, replication, and pathogenesis. J. Med. Virol. 2020;92:418–423. - PMC - PubMed
    1. Cock P.J.A., Antao T., Chang J.T., Chapman B.A., Cox C.J., Dalke A., Friedberg I., Hamelryck T., Kauff F., Wilczynski B., de Hoon M.J. Biopython: freely available Python tools for computational molecular biology and bioinformatics. Bioinformatics. 2009;25:1422–1423. - PMC - PubMed
    1. Davidson A.D., Williamson M.K., Lewis S., Shoemark D., Carroll M.W., Heesom K.J., Zambon M., Ellis J., Lewis P.A., Hiscox J.A., Matthews D.A. Characterisation of the transcriptome and proteome of SARS-CoV-2 reveals a cell passage induced in-frame deletion of the furin-like cleavage site from the spike glycoprotein. Genome Med. 2020;12:68. - PMC - PubMed

Publication types