. 2021 Apr 15;184(8):2212-2228.e12.
doi: 10.1016/j.cell.2021.02.053. Epub 2021 Mar 2.

Soluble ACE2-mediated cell entry of SARS-CoV-2 via interaction with proteins related to the renin-angiotensin system

Affiliations

Soluble ACE2-mediated cell entry of SARS-CoV-2 via interaction with proteins related to the renin-angiotensin system

Man Lung Yeung et al. Cell. .

Erratum in

Abstract

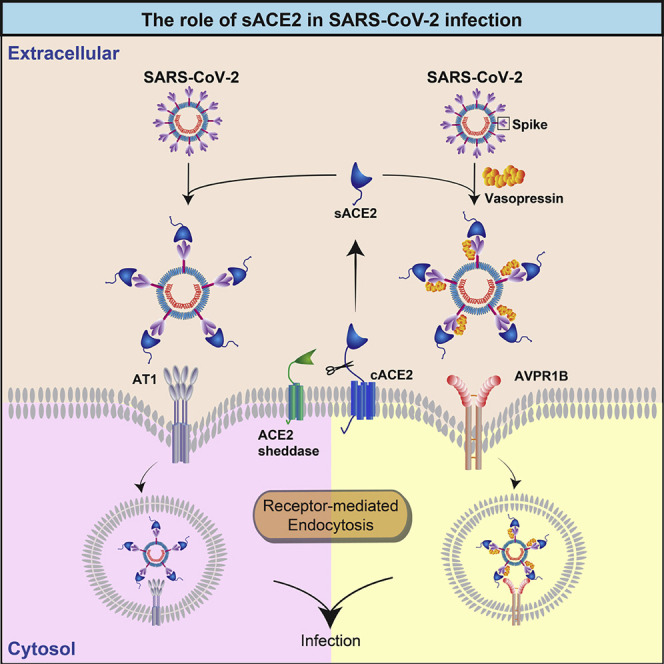
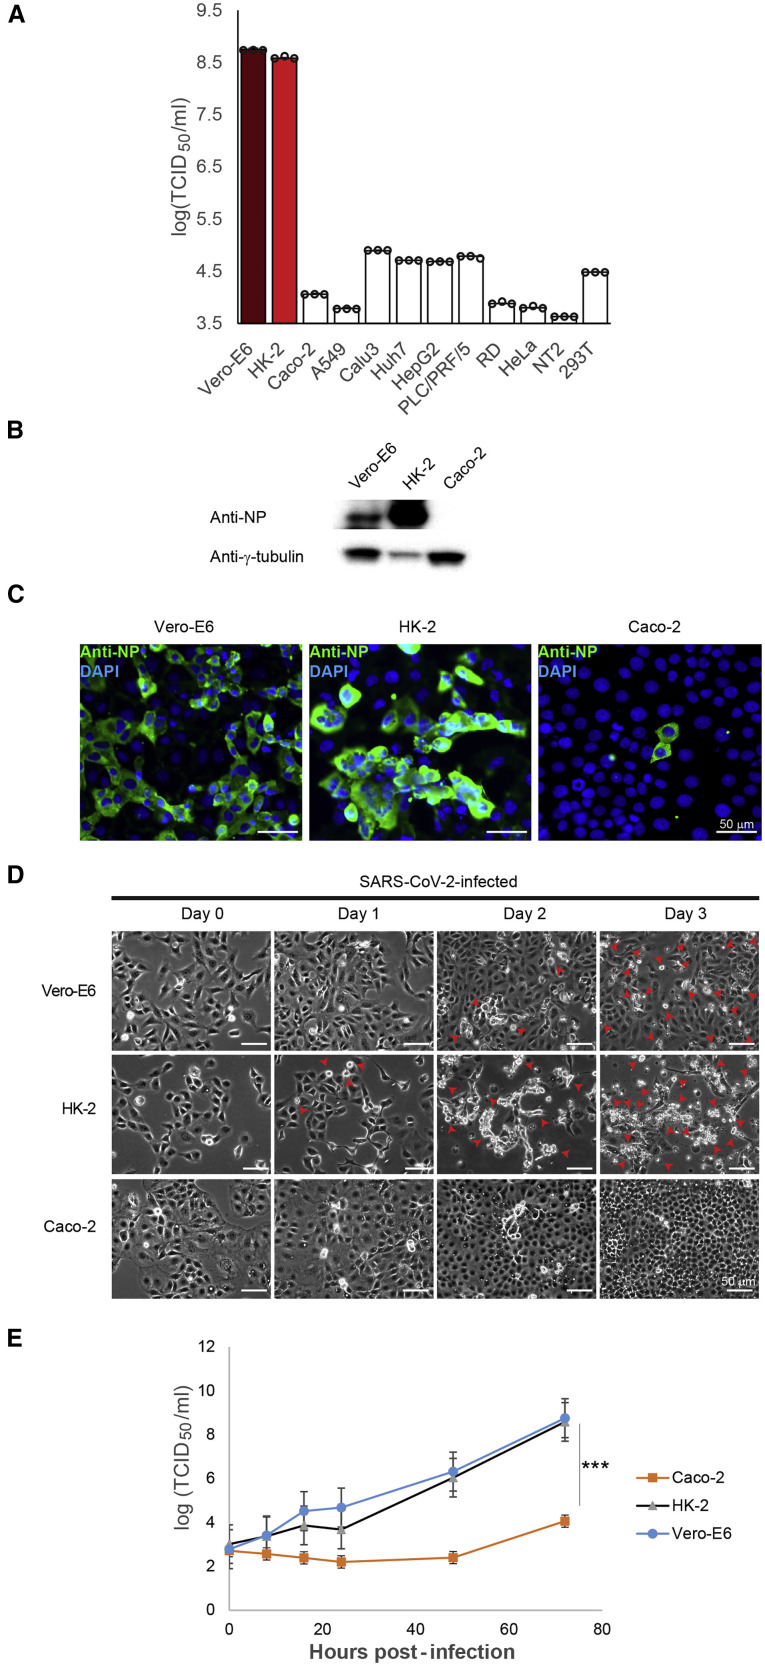
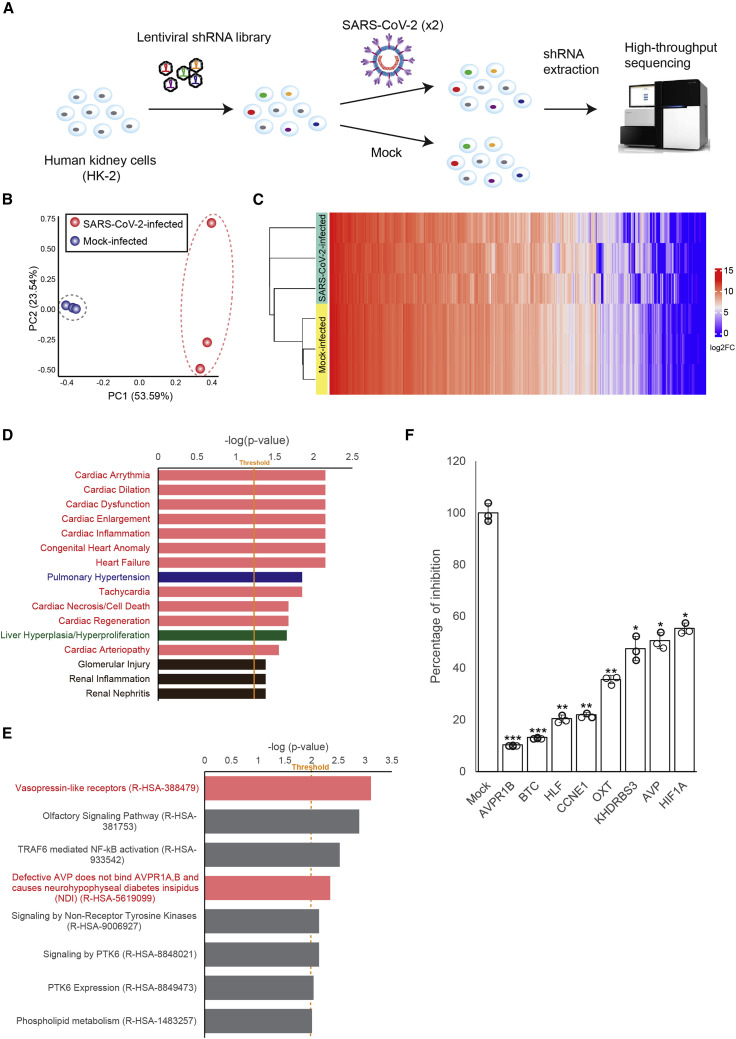
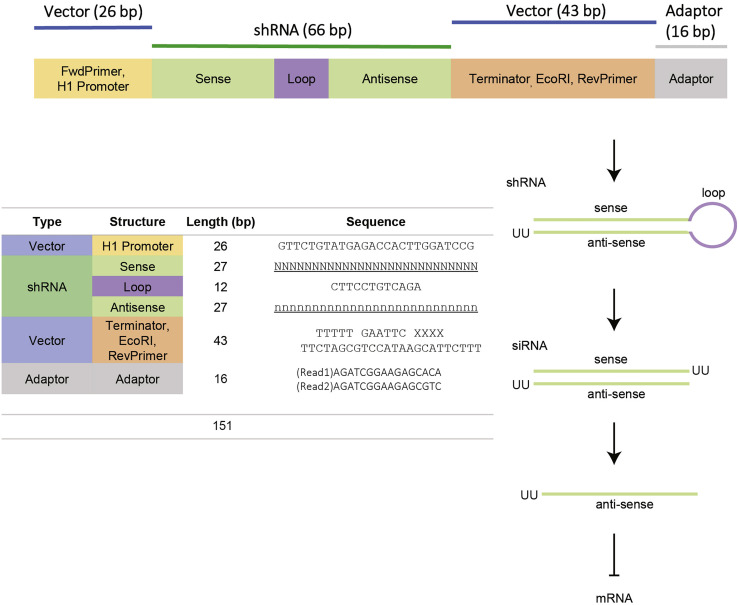
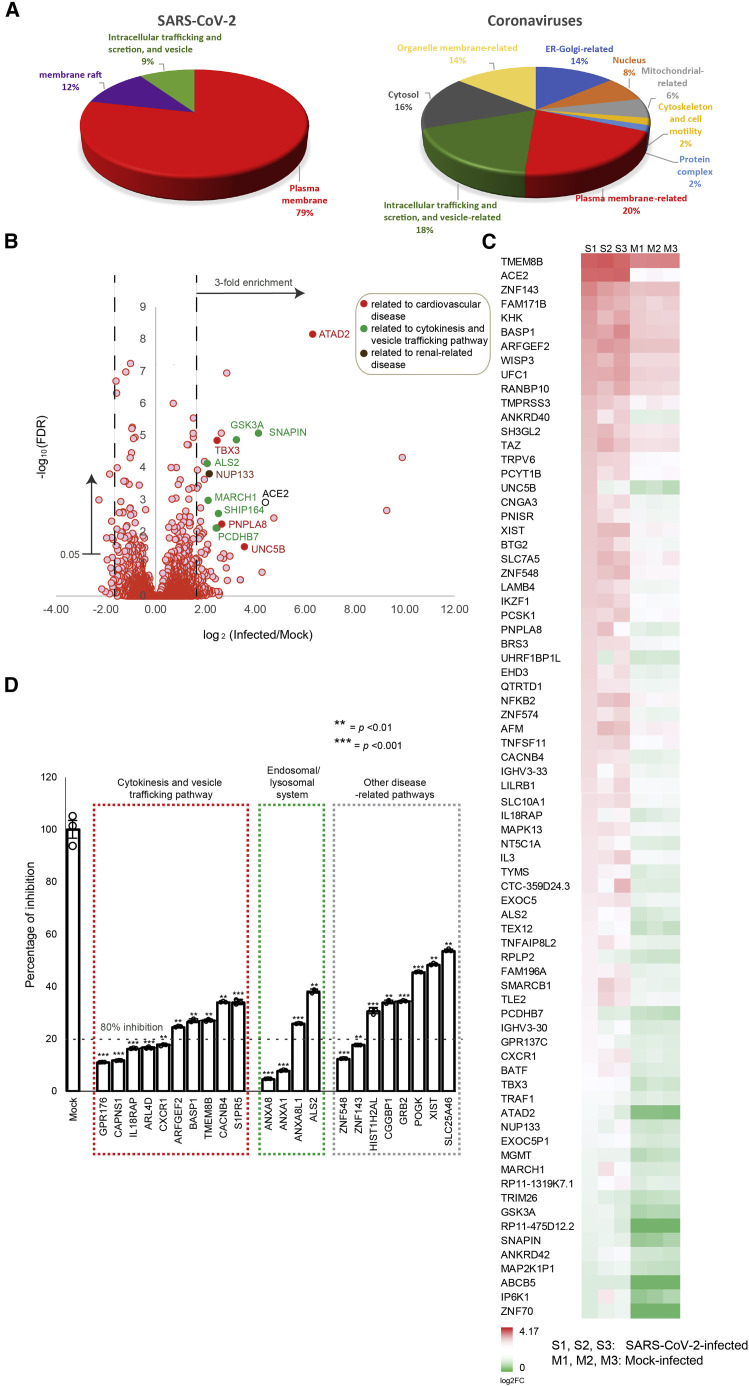
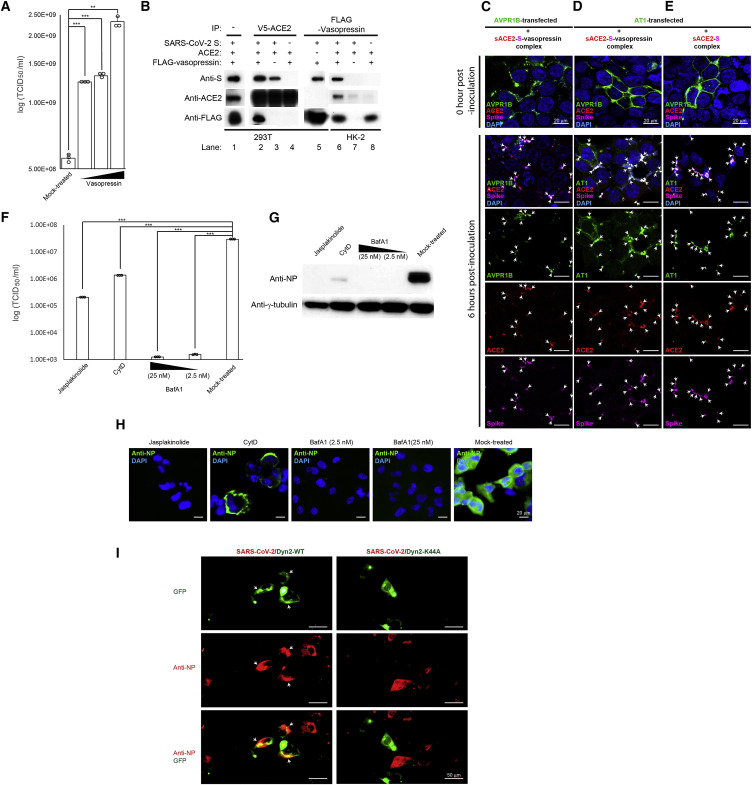
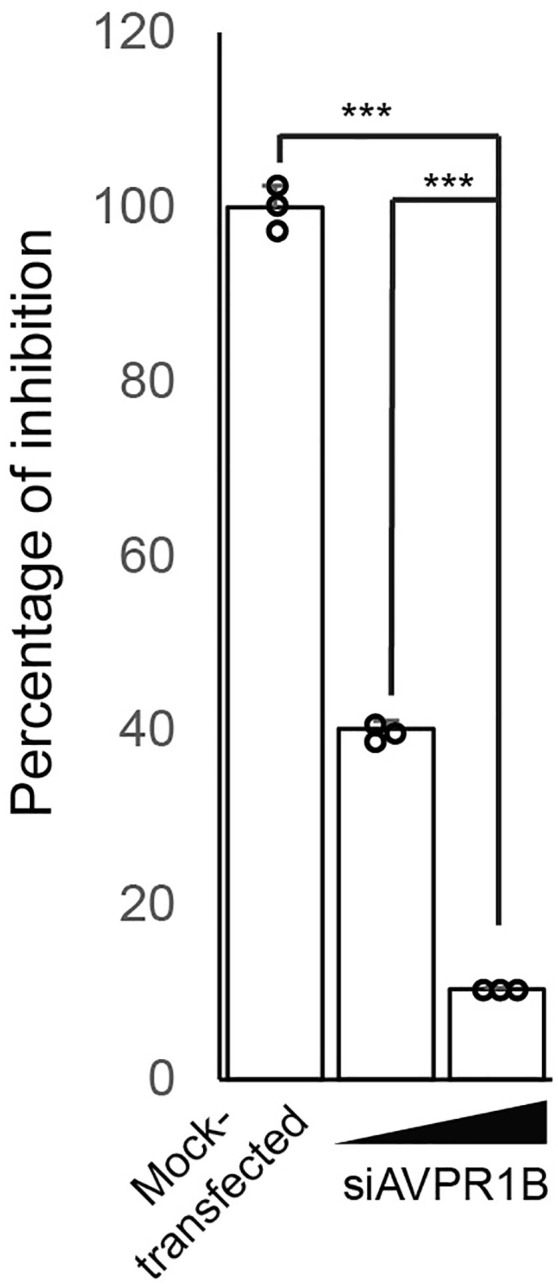
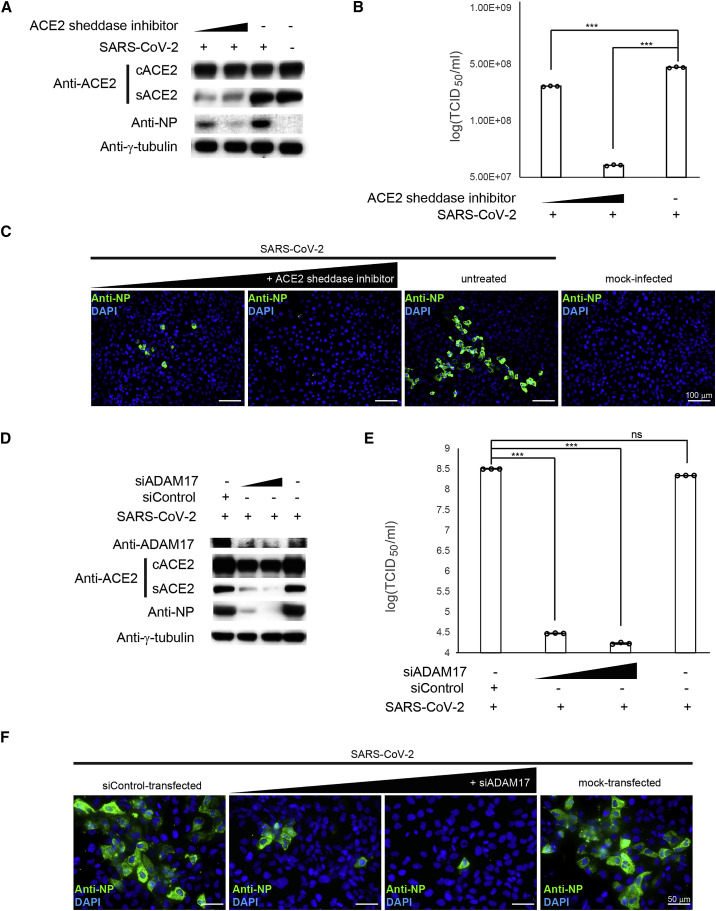
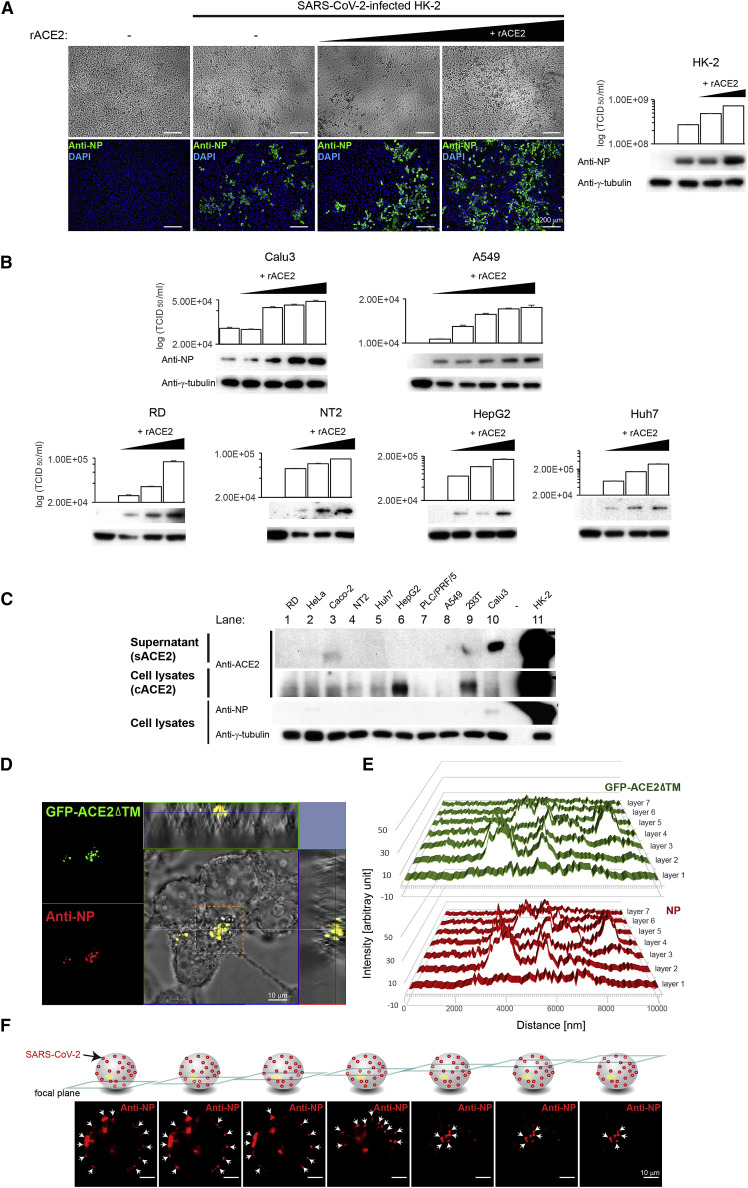
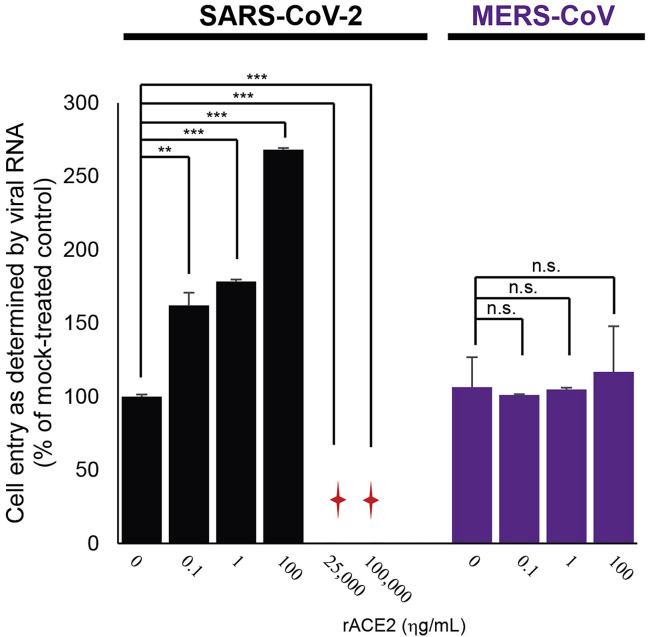
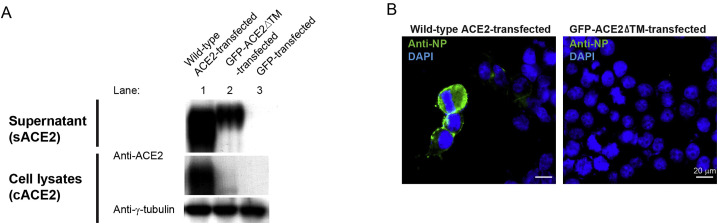
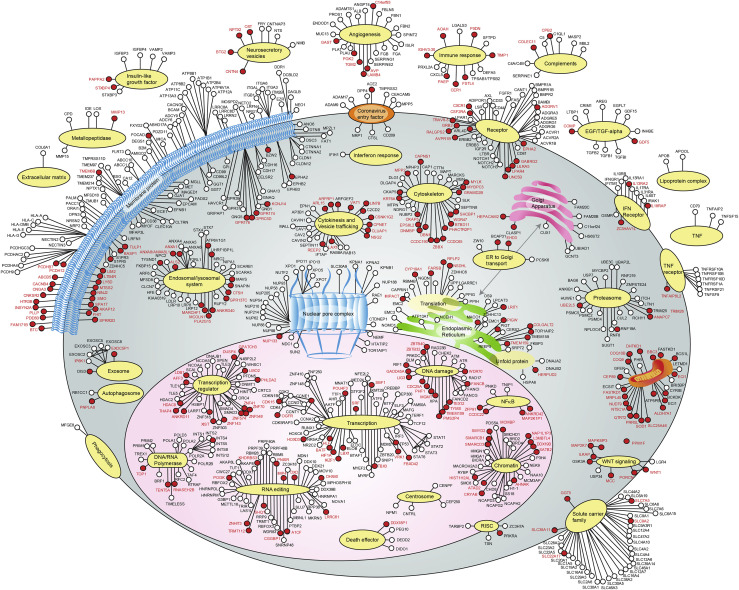
Severe acute respiratory syndrome coronavirus 2 (SARS-CoV-2) can cause acute respiratory disease and multiorgan failure. Finding human host factors that are essential for SARS-CoV-2 infection could facilitate the formulation of treatment strategies. Using a human kidney cell line-HK-2-that is highly susceptible to SARS-CoV-2, we performed a genome-wide RNAi screen and identified virus dependency factors (VDFs), which play regulatory roles in biological pathways linked to clinical manifestations of SARS-CoV-2 infection. We found a role for a secretory form of SARS-CoV-2 receptor, soluble angiotensin converting enzyme 2 (sACE2), in SARS-CoV-2 infection. Further investigation revealed that SARS-CoV-2 exploits receptor-mediated endocytosis through interaction between its spike with sACE2 or sACE2-vasopressin via AT1 or AVPR1B, respectively. Our identification of VDFs and the regulatory effect of sACE2 on SARS-CoV-2 infection shed insight into pathogenesis and cell entry mechanisms of SARS-CoV-2 as well as potential treatment strategies for COVID-19.

Keywords: ACE2; COVID-19; RNAi; SARS-CoV-2; sACE2; vasopressin; virus dependency factor.


Conflict of interest statement

Declaration of interests J.F.-W.C. has received travel grants from Pfizer Corporation Hong Kong and Astellas Pharma Hong Kong Corporation Limited and was an invited speaker for Gilead Sciences Hong Kong Limited and Luminex Corporation. The other authors declare no competing interests.

Figures

None
Graphical abstract
Figure 1
Figure 1
Susceptibilities of human cell lines of different organs to infection by SARS-CoV-2 (A) Human cell lines (HK-2 [red], Caco-2, A549, Calu3, Huh7, HepG2, PLC/PRF/5, RD, HeLa, NT2, and 293T) and Vero-E6 (deep red) were subjected to infection by SARS-CoV-2. Cell lysates were collected and assayed for infectious viral titer. (B) Western blot (WB) analysis detecting viral antigens using anti-nucleocapsid protein (NP) antibody in SARS-CoV-2-infected Vero-E6, HK-2, and Caco-2 cells. (C) Immunofluorescence assay (IFA) of Vero-E6, HK-2, and Caco-2 cells infected with SARS-CoV-2 using rabbit antiserum against NP. Scale bars represent 50 μm. (D) SARS-CoV-2-induced cytopathic effects (CPEs) were monitored in infected Vero-E6, HK-2, and Caco-2 cells. Arrows point to the cells showing CPEs with rounding up of cells progressively detaching from the monolayer. (E) Virus replication kinetics in infected Vero-E6, HK-2, and Caco-2 were monitored. Cell lysates were harvested from respective time points and viral titers were determined. The TCID50/mL results from (A) and (E) were derived from three independent experiments. Each data point and error bar depict the mean value and SEM, respectively. Statistical analyses were carried out using Student’s t test. Statistical significance is indicated by the asterisks (∗∗∗p < 0.001). Images from (B–D) are representatives of three independent experiments.
Figure 2
Figure 2
Identification of host factors essential for SARS-CoV-2 infection using a genome-wide RNAi screening (A) Schematic representation of RNAi screening to identify virus dependency factors (VDFs) essential for SARS-CoV-2 infection. The identity of shRNA in the survived and mock-infected control cells were determined via high-throughput sequencing. (B) Principal component analysis of the shRNA-targeted genes identified in SARS-CoV-2- (red dots; n = 3) and mock-infected (blue dots; n = 3) shRNA-expressing cell clones. (C) Heatmap analysis of all shRNA-targeted genes identified in SARS-CoV-2- and mock-infected shRNA-expressing cell clones. (D) Pathway analysis of the identified VDFs essential for SARS-CoV-2 infection. Analysis of VDFs with ≥3-fold enrichment in infected HK-2 cells revealed significantly (p < 0.05) affected biological pathways related to cardiac (pink), pulmonary (blue), liver (green), and renal diseases (brown). (E) PANTHER pathway analysis of VDFs with ≥3-fold enrichment that are essential for SARS-CoV-2 infection. Significantly affected (p < 0.001) pathways related to the regulation of cardiovascular system (pink) are indicated. (F) siRNA knockdown of VDFs involved in the vasopressin-related pathway in HK-2 cells leads to an inhibition of SARS-CoV-2 replication as assessed by qRT-PCR. Transfection of non-targeting siRNA was included as the negative control (mock). The results were derived from three independent experiments. Each data point and error bar depict the mean value and SEM, respectively. Statistical analyses were carried out using Student’s t test. Statistical significance is indicated by the asterisks (p < 0.05; ∗∗p < 0.01; ∗∗∗p < 0.001).
Figure S1
Figure S1
Design of the shRNA expression cassette, related to Figure 2
Figure 3
Figure 3
VDFs related to cytokinesis, vesicle trafficking, and endosomal/lysosomal system are important for SARS-CoV-2 infection (A) Gene ontology (GO) enrichment analysis of VDFs identified in our RNAi screening (left) and that reported by other coronavirus studies (right) using a threshold p value of 0.05. The percentage of each GO term is shown in pie charts. (B) Volcano plot analysis of VDFs identified in our RNAi screening. Gene annotation revealed that some enriched VDFs ≥3-fold enrichment and false positive rates (FDRs) <5% have functional roles related to the regulation of the cardiovascular system (filled red), cytokinesis and vesicle trafficking pathway (filled green), and renal-related disease (filled brown). (C) Heatmap analysis of the ≥3-fold enriched VDFs with FDRs < 0.05. S1–3 and M1–3 are biological replicates of SARS-CoV-2- and mock-infected samples, respectively. (D) siRNA knockdown of selected VDFs in HK-2 cells leads to an inhibition of SARS-CoV-2 replication as assessed by qRT-PCR. Transfection of non-targeting siRNA was included as negative control (mock). Data points below the dotted line indicate siRNA inhibitory effects on SARS-CoV-2 infection to be >80%. The results were derived from three independent experiments. Each data point and error bar depict the mean value and SEM, respectively. Statistical analyses were carried out using Student’s t test. Statistical significance is indicated by the asterisks (∗∗p < 0.01; ∗∗∗p < 0.001).
Figure 4
Figure 4
Formation of a protein complex containing sACE2, S of SARS-CoV-2, and/or vasopressin facilitates SARS-CoV-2 cell entry via Dyn2-dependent endocytosis (A) Effect of vasopressin on SARS-CoV-2 infectivity. The HK-2 cells were pretreated with increasing doses of vasopressin followed by SARS-CoV-2 infection. Mock-treated HK-2 cells were included as a control. (B) Co-immunoprecipitation of sACE2, vasopressin, and S. WB analysis of conditioned supernatants of FLAG-tagged vasopressin- and V5-tagged ACE2-doubly transfected 293T cells with spike-in recombinant S (lane 1). Co-immunoprecipitation of V5-tagged ACE2 (lanes 2–4) and FLAG-tagged vasopressin (lane 5) from conditioned supernatants of transfected 293T cells using anti-V5 and anti-FLAG antibodies, respectively. Co-immunoprecipitation of FLAG-tagged vasopressin from conditioned supernatants of transfected HK-2 cells using anti-FLAG antibodies (lane 6–8). Detection of S, ACE2, and vasopressin was performed using specific antibodies. (C) IFA of SARS-CoV-2 S, sACE2, and AVPR1B-transfected 293T cells. The 293T cells were transfected with a plasmid encoding AVPR1B prior to inoculation with HK-2 conditioned supernatant containing sACE2, recombinant S, and vasopressin. The cells were fixed and immunostained with anti-S (magenta), anti-ACE2 (red), and anti-AVPR1B (green) antibodies. Scale bars represent 20 μm. (D and E) IFA of SARS-CoV-2 S, sACE2, and AT1 receptor-transfected 293T cells using specific antibodies. The 293T cells were transfected with a plasmid encoding YFP-tagged AT1 receptor prior to inoculation with HK-2 conditioned supernatant containing sACE2, recombinant S of SARS-CoV-2, and/or vasopressin. The cells were fixed and immunostained with respective anti-S (magenta) and anti-ACE2 (red) antibodies. Scale bars represent 20 μm. (F) HK-2 cells were treated with Jasplakinolide, Cytochalasin D (CytD), or Bafilomycin A1 (BafA1) prior to SARS-CoV-2 infection. Cell lysates were assayed for viral titer. Mock-treated HK-2 cells were included as control. (G) WB analysis detecting viral antigens via anti-NP antibodies in drug-pretreated HK-2 cells as described in (F). (H) IFA of SARS-CoV-2 NP (green) in drug-pretreated HK-2 cells described in (F) using specific antibodies. Cells were counterstained with DAPI to label nuclei (blue). Scale bars represent 20 μm. (I) IFA of SARS-CoV-2 NP (red) in infected HK-2 cells using specific antibodies. The HK-2 cells were transfected with a plasmid encoding GFP-tagged wild-type dynamin 2 (Dyn2-WT) or GFP-tagged dominant-negative Dyn2 (Dyn2-K44A) prior to SARS-CoV-2 infection. Scale bars represent 50 μm. The results from (A) and (F) were derived from three independent experiments. Each data point and error bar depict the mean value and SEM, respectively. Statistical analyses were carried out using Student’s t test. Statistical significance is indicated by the asterisks (∗∗p < 0.01; ∗∗∗p < 0.001). Images from (B–E) and (G–I) are representatives of three independent experiments. Arrows point to co-localized fluorescent signals.
Figure S2
Figure S2
Knockdown effect of AVPR1B on SARS-CoV-2 infectivity, related to Figure 2 The HK-2 cells were transfected with different doses of siAVPR1B 24 h before SARS-CoV-2 infection. Transfection of non-targeting siRNA was included as negative control (Mock-transfected). Statistical analyses were carried out using Student’s t test. Statistical significance is indicated by the asterisks (∗∗∗p < 0.001).
Figure 5
Figure 5
ACE2 shedding modulates the SARS-CoV-2 infectivity (A) WB analysis showing expression levels of cellular ACE2 (cACE2) and secretory ACE2 (sACE2) in HK-2 cells pretreated with different doses of ACE2 sheddase inhibitor prior to SARS-CoV-2 infection (lanes 1 and 2). Untreated (lane 3) and mock-infected (lane 4) controls were included. SARS-CoV-2 NP was detected using specific antibodies. (B) Cell lysates of samples described in (A) were assayed for viral titer. Untreated and mock-infected cells were included as controls. (C) IFA of SARS-CoV-2 NP (green) in pretreated HK-2 cells described in (A) using specific antibodies. Cells were counterstained with DAPI to label nuclei (blue). Scale bars represent 100 μm. (D) WB analysis showing expression levels of cACE2 and sACE2 in HK-2 cells transfected with different amount of siADAM17 (lanes 2 and 3). siControl-transfected (lane 1) and mock-transfected (lane 4) controls were included. The SARS-CoV-2 NP was detected using specific antibodies. (E) Cell lysates of samples described in (D) were assayed for viral titer. (F) IFA of SARS-CoV-2 NP (green) in pretreated HK-2 cells as described in (D) using specific antibodies. Cells were counterstained with DAPI to label nuclei (blue). Scale bars represent 50 μm. TCID50/mL results from (B) and (E) were derived from three independent experiments. Each data point and error bar depict the mean value and SEM, respectively. Statistical analyses were carried out using Student’s t test. Statistical significance is indicated by the asterisks (∗∗∗p < 0.001; ns: p > 0.05). Images from (A), (C), (D), and (F) are representatives of three independent experiments.
Figure 6
Figure 6
SARS-CoV-2 infection depends on sACE2 (A) Left: IFA of SARS-CoV-2 NP (green) in HK-2 cells pretreated with different doses of recombinant ACE2 (rACE2) prior to infection by SARS-CoV-2. Untreated and mock-infected controls were included. Cells were counterstained with DAPI to label nuclei (blue). Corresponding CPE were also shown. Scale bars represent 200 μm. Right: WB analysis detecting viral antigens using anti-NP antibodies in HK-2 cells described in (A). Corresponding TCID50 results were presented above the blot images. (B) WB analysis detecting viral antigens using anti-NP antibodies in SARS-CoV-2-infected cells pretreated with increasing doses of rACE2. Corresponding TCID50 results were presented above the blot images. (C) WB analysis detecting expression levels of cACE2 and sACE2 in human cell lines of different organs that were infected with SARS-CoV-2. SARS-CoV-2 NP was detected using specific antibodies. (D) Confocal image with orthogonal projections of SARS-CoV-2 infected 293T cells transfected with mutant GFP-ACE2ΔTM. Co-localization signal (yellow) was observed between SARS-CoV-2 NP (red) and mutant ACE2 (GFP-ACE2ΔTM; green). Scale bar represents 10 μm. The 3D reconstruction of the confocal images is available in Video S1. (E) Profiles of fluorescent intensity of NP (red) and GFP-ACE2ΔTM (green) measured at different layers of the confocal images described in (D; boxed area in orange). (F) Optical sectioning of the SARS-CoV-2-infected 293T cell expressing the GFP-ACE2ΔTM. Arrows indicate NP (red), which showed a punctate pattern predominately localized on the cell surface. Scale bars represent 10 μm. Images from (A–D) and (F) are representatives of three independent experiments. Each data point and error bar depict the mean value and SEM, respectively.
Figure S3
Figure S3
Effect of ACE2 on SARS-CoV-2 and MERS-CoV cell entry, related to Figure 6 The HK-2 cells were treated with different doses of recombinant ACE2 (rACE2) protein prior to SARS-CoV-2 (black) or MERS-CoV (purple) infection separately. Cell entry of the SARS-CoV-2- or MERS-CoV-inoculated HK-2 cells was evaluated by measuring viral RNAs using qRT-PCR. Sample with undetectable viral RNA is marked with a red cross.
Figure S4
Figure S4
Characterization of subcellular localization of the wild-type and mutant ACE2, related to Figure 6 (A) WB analysis showing expression levels of cACE2 and sACE2 in 293T cells transfected with a plasmid encoding wild-type ACE2 (lane 1), GFP-tagged mutant ACE2 lacking the transmembrane domain (GFP-ACE2ΔTM) (lane 2), or GFP (lane 3) prior to SARS-CoV-2 infection. (B) IFA of SARS-CoV-2 NP (green) in 293T cells transfected with wild-type ACE2 (left) and mutant GFP-ACE2ΔTM (right). Cells were counterstained with DAPI to label nuclei (blue). Scale bars represent 20 μm.
Figure 7
Figure 7
A coronavirus life cycle map The function and subcellular localization of VDFs were determined based on the use of multiple databases (please see STAR Methods) and the literature. VDFs that were discovered only in this study are indicated by red-filled dots, and the gene symbols are written in red.VDFs discovered in this study and previously reported in other studies are indicated by red-filled dots, and the gene symbols are written in black. VDFs identified in other studies are indicated by open dots, and the gene symbols are written in black. The information of the VDFs identified in this study is listed in Table S1.
Figure S5
Figure S5
Mapping of high-throughput sequencing reads to human genome, related to Figures 2, 3, and 7

Comment in

Similar articles

Cited by

References

    1. Anders S., Pyl P.T., Huber W. HTSeq--a Python framework to work with high-throughput sequencing data. Bioinformatics. 2015;31:166–169. - PMC - PubMed
    1. Ashburner M., Ball C.A., Blake J.A., Botstein D., Butler H., Cherry J.M., Davis A.P., Dolinski K., Dwight S.S., Eppig J.T., et al. The Gene Ontology Consortium Gene ontology: tool for the unification of biology. Nat. Genet. 2000;25:25–29. - PMC - PubMed
    1. Babapoor-Farrokhran S., Rasekhi R.T., Gill D., Babapoor S., Amanullah A. Arrhythmia in COVID-19. SN Compr. Clin. Med. 2020 doi: 10.1007/s42399-020-00454-2. - DOI - PMC - PubMed
    1. Bairoch A., Apweiler R., Wu C.H., Barker W.C., Boeckmann B., Ferro S., Gasteiger E., Huang H., Lopez R., Magrane M., et al. The Universal Protein Resource (UniProt) Nucleic Acids Res. 2005;33:D154–D159. - PMC - PubMed
    1. Bandsma R.H., van Goor H., Yourshaw M., Horlings R.K., Jonkman M.F., Schölvinck E.H., Karrenbeld A., Scheenstra R., Kömhoff M., Rump P., et al. Loss of ADAM17 is associated with severe multiorgan dysfunction. Hum. Pathol. 2015;46:923–928. - PMC - PubMed

Publication types