. 2021 Nov;148(5):1198-1209.
doi: 10.1016/j.jaci.2021.02.040. Epub 2021 Mar 10.

Endotype of allergic asthma with airway obstruction in urban children

Affiliations

Endotype of allergic asthma with airway obstruction in urban children

Matthew C Altman et al. J Allergy Clin Immunol. 2021 Nov.

Abstract

Background: Black and Hispanic children growing up in disadvantaged urban neighborhoods have the highest rates of asthma and related morbidity in the United States.

Objectives: This study sought to identify specific respiratory phenotypes of health and disease in this population, associations with early life exposures, and molecular patterns of gene expression in nasal epithelial cells that underlie clinical disease.

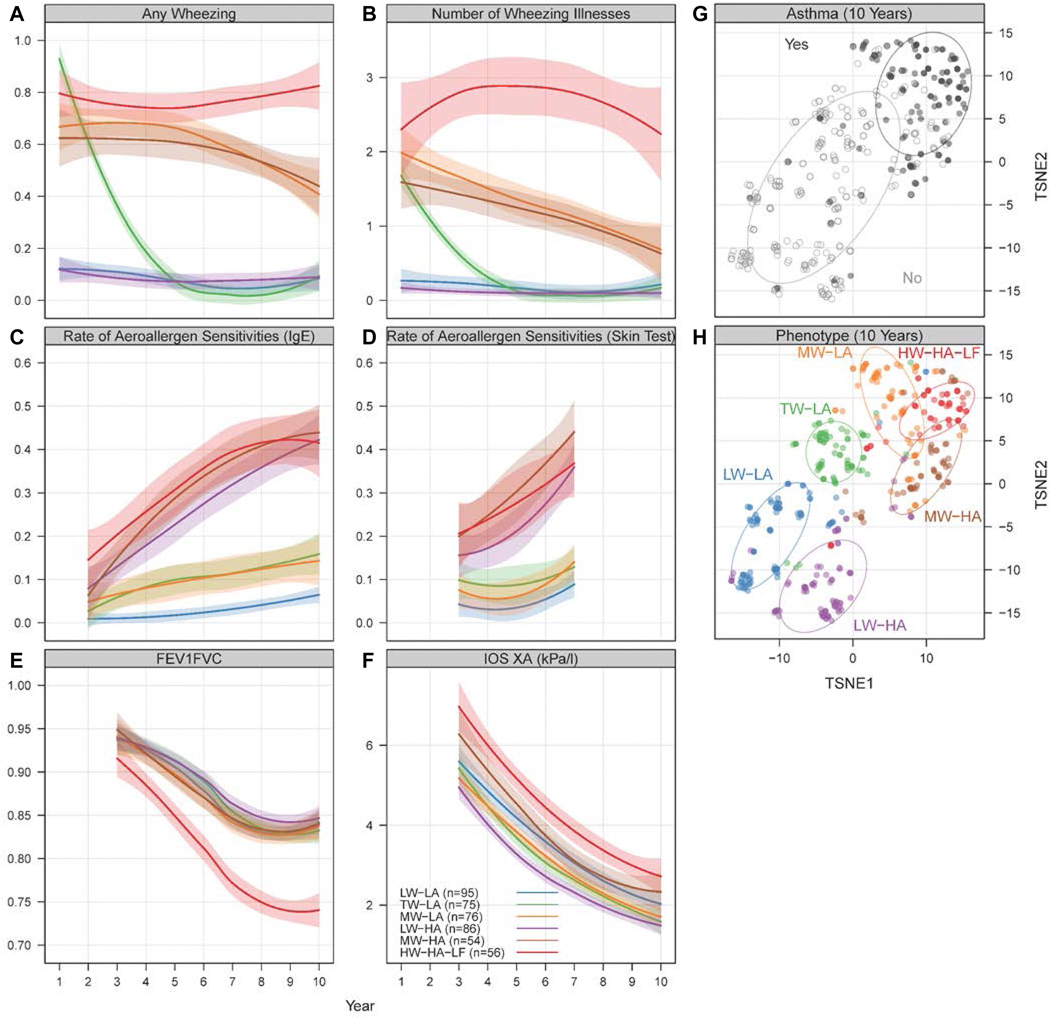
Methods: The study population consisted of 442 high-risk urban children who had repeated assessments of wheezing, allergen-specific IgE, and lung function through 10 years of age. Phenotypes were identified by developing temporal trajectories for these data, and then compared to early life exposures and patterns of nasal epithelial gene expression at 11 years of age.

Results: Of the 6 identified respiratory phenotypes, a high wheeze, high atopy, low lung function group had the greatest respiratory morbidity. In early life, this group had low exposure to common allergens and high exposure to ergosterol in house dust. While all high-atopy groups were associated with increased expression of a type-2 inflammation gene module in nasal epithelial samples, an epithelium IL-13 response module tracked closely with impaired lung function, and a MUC5AC hypersecretion module was uniquely upregulated in the high wheeze, high atopy, low lung function group. In contrast, a medium wheeze, low atopy group showed altered expression of modules of epithelial integrity, epithelial injury, and antioxidant pathways.

Conclusions: In the first decade of life, high-risk urban children develop distinct phenotypes of respiratory health versus disease that link early life environmental exposures to childhood allergic sensitization and asthma. Moreover, unique patterns of airway gene expression demonstrate how specific molecular pathways underlie distinct respiratory phenotypes, including allergic and nonallergic asthma.

Keywords: Childhood asthma; endotypes; environmental exposures; phenotypes; transcriptomics.


Figures

Figure 1.
Figure 1.
Respiratory phenotypes in URECA. (A-F) Observed trajectories for variables used in clustering algorithm among URECA participants through age 10 years. Latent class mixed models were performed, and the optimal number of classes selected is plotted. Each model is constructed separately for each variable; thus, the classes are unrelated between variables. Longitudinal data for each of the groups are represented by the colored lines (shading indicated SEs). (G,H) The two-dimensional distance matrix used in the construction of childhood URECA phenotypes by asthma and cluster group is described by using t-distributed stochastic neighbor embedding (TSNE), a dimension-reduction technique for high-dimensional data. Each point represents a study subject, and colors in (H) indicate phenotype assignments.
Figure 2.
Figure 2.
Differentially expressed modules by respiratory phenotypes. (A) The heatmap shows the 26 differentially expressed modules among the 6 respiratory phenotypes. Module expression levels are shown as row normalized Z-scores of the mean expression for each group (columns) with red representing higher relative expression and blue representing lower expression. The groups are ordered left to right by increasing wheeze within low atopy and high atopy groups as indicated. (B) The differentially expressed modules in the HW-HA-LF group and (C) the differentially expressed modules in the MW-LA group. Differential expression was assessed by ANOVA and post hoc pairwise comparisons using a weighted linear model (limma) appropriate for RNA-seq data and empirical Bayes method. The model included terms to account for cell percentages and city of residence. Significant differences in modules are colored red (increased) or blue (decreased) with the color intensity according the fold change (log2) relative to the group level mean expression. The module network demonstrates the coassociations among all modules identified in this study (squares). Edges represent significant positive Pearson correlations >0.5 (FDR<0.05) and darker edges indicate higher correlations. Nodes are clustered according to their interconnectedness. Group numbers are HW-HA-LF n=46, MW-HA n=35, LW-HA n=61, MW-LA n=57, TW-LA n=50, LW-LA n=69.
Figure 3.
Figure 3.
Modules increased in expression in HW-HA-LF. (A) The log2 expression levels of the “Epithelium response to IL-13” module (M4) according to the six respiratory phenotypes. Shown are median values (horizontal), interquartile ranges (boxes), and 1.5 IQR (whiskers). (B) Gene-gene associations for M4 demonstrate a significant interaction network centered around key genes; shown are the central most genes in the network. Genes are represented as ellipses (nodes) and known gene-gene interactions from STRING as connecting edges. The size of each node is proportional to the number of interactions in the full network. (C) Linear regression of the FEV1/FVC values (shown as a percent) and (D) log2 PC20 values versus the log2 expression levels of M4. Points are colored by phenotype group according to the legend. (E-G) The analogous plots of the MUC5AC hypersecretion module (M21). Group numbers are HW-HA-LF n=46, MW-HA n=35, LW-HA n=61, MW-LA n=57, TW-LA n=50, LW-LA n=69.
Figure 4.
Figure 4.
Modules specifically differentially expressed in MW-LA. (A) The log2 expression levels of the “Epithelial integrity and leukocyte migration” module (M20) according to the six respiratory phenotypes. Shown are median values (horizontal), interquartile ranges (boxes), and 1.5 IQR (whiskers). (B) Gene-gene associations for M20 demonstrate a significant interaction network centered around key genes; shown are the central most genes in the network. Genes are represented as ellipses (nodes) and known gene-gene interactions from STRING as connecting edges. The size of each node is proportional to the number of interactions in the full network. (C,D) The analogous plots of the “Injury response” module (M14). Group numbers are HW-HA-LF n=46, MW-HA n=35, LW-HA n=61, MW-LA n=57, TW-LA n=50, LW-LA n=69.

References

    1. Zahran HS, Bailey CM, Damon SA, Garbe PL, Breysse PN. Vital Signs: Asthma in Children - United States, 2001–2016. MMWR Morb Mortal Wkly Rep 2018; 67:149–55. - PMC - PubMed
    1. Platts-Mills TA. The allergy epidemics: 1870–2010. J Allergy Clin Immunol 2015; 136:3–13. - PMC - PubMed
    1. Oksel C, Granell R, Haider S, Fontanella S, Simpson A, Turner S, et al. Distinguishing Wheezing Phenotypes from Infancy to Adolescence. A Pooled Analysis of Five Birth Cohorts. Ann Am Thorac Soc 2019; 16:868–76. - PMC - PubMed
    1. Jackson DJ, Gern JE, Lemanske RF Jr., Lessons learned from birth cohort studies conducted in diverse environments. J Allergy Clin Immunol 2017; 139:379–86. - PMC - PubMed
    1. Bacharier LB, Beigelman A, Calatroni A, Jackson DJ, Gergen PJ, O’Connor GT, et al. Longitudinal Phenotypes of Respiratory Health in a High-Risk Urban Birth Cohort. Am J Respir Crit Care Med 2019; 199:71–82. - PMC - PubMed

Publication types