. 2021 Mar 10;13(6):8421-8439.
doi: 10.18632/aging.202653. Epub 2021 Mar 10.

PGC-1α alleviates mitochondrial dysfunction via TFEB-mediated autophagy in cisplatin-induced acute kidney injury

Affiliations

PGC-1α alleviates mitochondrial dysfunction via TFEB-mediated autophagy in cisplatin-induced acute kidney injury

Longhui Yuan et al. Aging (Albany NY). .

Abstract

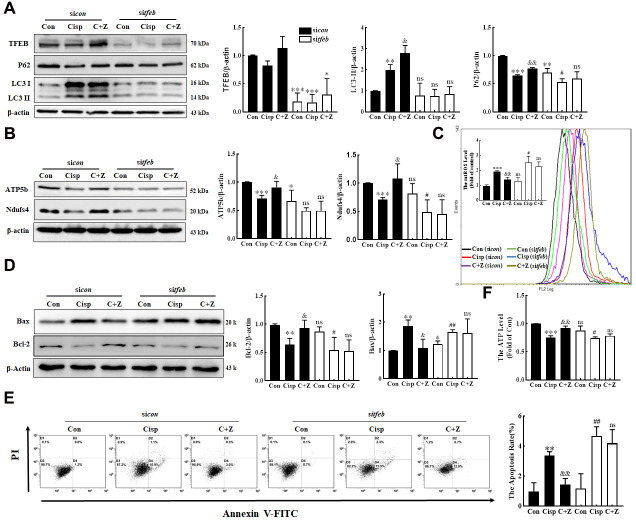
Because of the key role of impaired mitochondria in the progression of acute kidney injury (AKI), it is striking that peroxisome proliferator γ coactivator 1-α (PGC-1α), a transcriptional coactivator of genes involved in mitochondrial biogenesis and autophagy, protects from kidney injury. However, the specific mechanism involved in PGC-1α-mediated autophagy remains elusive. In vivo, along with the severe kidney damage, the expression of PGC-1α was decreased in cisplatin-induced AKI mice. Conversely, PGC-1α activator (ZLN005) administration could alleviate kidney injury. Consistently, in vitro overexpression of PGC-1α or ZLN005 treatment inhibited cell apoptosis and mitochondrial dysfunction induced by cisplatin. Moreover, ZLN005 treatment increased the expression of LC3-II and co-localization between LC3 and mitochondria, suggesting that the mitophagy was activated. Furthermore, PGC-1α-mediated the activation of mitophagy was reliant on the increased expression of TFEB, and the protective effects were abrogated in TFEB-knockdown cells. These data suggest that the activation of PGC-1α could alleviate mitochondrial dysfunction and kidney injury in AKI mice via TFEB-mediated autophagy.

Keywords: PGC-1α; TFEB; acute kidney injury; autophagy; mitochondrial dysfunction.


Conflict of interest statement

CONFLICTS OF INTEREST: The authors declare that they have no conflicts of interest.

Figures

Figure 1
Figure 1
The expression of PGC-1α was down-regulated in AKI mice. The male C57BL/6 mice were injected with a single dose of cisplatin (16mg/kg, i.p.) to induce AKI and sacrificed on 4th day. (A) Serum BUN and Crea levels were quantified in each group (n=10). (B) Representative images of HE- and PAS-stained kidney sections. Scar bar: 50 μm. (C) Representative images of western blotting and the quantitative analysis of PGC-1α. Data are provided as the mean ± SEM, n=3 independent experiments. **P < 0.01, ***P < 0.001 vs. Con (NC, normal control; Cisp, cisplatin; BUN, blood urea nitrogen; Crea, serum creatinine; HE, hematoxylin and eosin; PAS, periodic acid-Schiff.).
Figure 2
Figure 2
PGC-1α alleviates cisplatin-induced injury in HK2 cells. HK2 cells were exposed to cisplatin (2.5 μM, 5 μM, 10 μM) for 48h. (A) Cell viability was determined by CCK8 assay. (B) Cisplatin-induced cell apoptosis were determined by flow cytometry. (C) The expression of apoptosis-related proteins (Bax and Bcl-2) and PGC-1α was measured by western blotting. (D) Over-PGC-1α attenuated cell apoptosis in cisplatin-treated (5 μM) HK2 cells (overcon, black column; overpgc-1α, white column). The expression of PGC-1α and Bcl-2 and Bax was analyzed by western blotting. (E) Apoptosis was determined by flow cytometry. Data are provided as the mean ± SEM, n=3 independent experiments. *P < 0.05, **P < 0.01, ***P < 0.001 vs. Con; &P < 0.05, &&P < 0.01 vs. Cisp. (overcon, overcontrol; Cisp, cisplatin).
Figure 3
Figure 3
Pharmacological activation of PGC-1α by ZLN005 treatment suppresses cisplatin-induced injury in vitro. HK2 cells treated with cisplatin (5 μM) were incubated with ZLN005 (10 μM) for 48 h. (A) cell viability was determined by CCK8 assay. (B) The expression of apoptosis-related proteins (Bax and Bcl-2) and PGC-1α was measured by western blotting. (C) The effects of ZLN005 on cisplatin-induced apoptosis were determined by flow cytometry. Data are provided as the mean ± SEM, n=3 independent experiments. *P < 0.05, **P < 0.01, ***P < 0.001 vs. Con; &P < 0.05 vs. Cisp. (Con, control; Zln, ZLN005; Cisp, cisplatin; C+Z, cisplatin + ZLN005).
Figure 4
Figure 4
Oral administration of ZLN005 prevents cisplatin-induced AKI. The male C57BL/6 mice were injected once with cisplatin (16mg/kg, i.p.) to induce AKI, followed by ZLN005 treatment (15mg/kg/d, i.g.) for 4 days. (A) Serum BUN and Crea levels were quantified in each group (n=10). (B) Representative images of HE- and PAS-stained kidney sections. (C) Representative images of immunohistochemical staining using anti-Kim-1 and anti-PGC-1α antibodies. Scar bar: 20 μm. (D) Representative images of western blotting and the quantitative analysis of PGC-1α, Bax and Bcl-2. (E) Representative micrographs showing TUNEL staining. Data are provided as the mean ± SEM, n=3 independent experiments. *P < 0.05, **P < 0.01 vs. Con; &P < 0.05, &&P < 0.01 vs. Cisp. (NC, normal control; Cisp, cisplatin; C+Z, cisplatin + ZLN005).
Figure 5
Figure 5
Activation of PGC-1α via ZLN005 inhibits cisplatin-induced mitochondria damage in vitro. (A) For the measurement of mitochondrial ROS (mtROS), HK2 cells were stained with Mito-SOX Red (2.5 μM) for 15 min at 37° C and determined by confocal microscope. Scar bar: 20 μm. (B) Mitochondrial ROS (mtROS) were measured by incubation with Mito-SOX Red. (C) The mitochondrial membrane potential measurement was detected with JC-1 (5 nM). Scar bar: 20 μm. (D) The expression of mitochondria-related proteins (ATP5b and Ndufs4) was measured by western blotting. (E) ATP content was measured by using an ATP Assay, ATP concentration was calculated in nmol/mg protein, and the data are represented as the rate of control. Data are provided as the mean ± SEM, n=3 independent experiments. *P < 0.05, **P < 0.01 vs. Con; &P < 0.05, &&P < 0.01, &&&P< 0.001 vs. Cisp. (Con, control; Zln, ZLN005; Cisp, cisplatin; C+Z, cisplatin + ZLN005).
Figure 6
Figure 6
PGC-1α positively regulate the TFEB in HK2 cells. (A) HK2 Cell lysates were immunoprecipitated (IP) with an anti-PGC-1α or an anti-TFEB antibody, then immunoblotted (IB) with TFEB and PGC-1α antibodies. Anti- IgG antibody as a negative control. (B, C) The expression of TFEB and PGC-1α was measured by western blotting. (D) Luciferase activity in HK-2 cells transfected with the TFEB promoter-reporter construct linked to luciferase along with PGC-1α plasmids or control empty vectors. (E) Representative immunofluorescence images of TFEB in HK2 cells. Scar bar: 20 μm. Data are provided as the mean ± SEM, n=3 independent experiments. *P < 0.05, **P < 0.01, ***P < 0.001 vs. overcon; #P < 0.05, ##P < 0.01, ###P < 0.001 vs sicon (Con, control; sicon, sicontrol; overcon, overcontrol).
Figure 7
Figure 7
PGC-1α activates autophagy by modulating TFEB. (A) The expression of the proteins P62 and LC3 was measured by western blotting in HK2 cells exposed to cisplatin (5 μM) in the presence or absence of HCQ (30 μM) for 48 h. (B) HK2 cells were exposed to cisplatin in the presence or absence of ZLN005 (10 μM) for 48 h, and the expression of the proteins TFEB, P62 and LC3was measured by western blotting. (C) HK2 cells treated with ZLN005 (10 μM) and p62 mRNA was measured by real-time PCR. (D) Representative images of the colocalization between LC3 and mitochondria. Data are provided as the mean ± SEM, n=3 independent experiments. *P < 0.05, **P < 0.01 vs. Con; &P < 0.05, &&P < 0.01 vs. Cisp. (Con, control; Zln, ZLN005; Cisp, cisplatin; C+Z, cisplatin + ZLN005; HCQ, hydroxychloroquine; C+H, cisplatin + hydroxychloroquine).
Figure 8
Figure 8
Silencing of TFEB partially abolishes the protective effects of ZLN005 in cisplatin-treated HK2 cells. HK2 cells were transfected with control siRNA (sicon, black column) or TFEB siRNA (sitfeb, white column) for 6 h and treated with cisplatin in the presence or absence of ZLN005 for 48 h. (A) The expression of autophagy-related protein (TFEB, P62 and LC3) was measured by western blotting. (B) The expression of mitochondria-related proteins (ATP5b and Ndufs4) was measured by western blotting. (C) Mitochondrial ROS (mtROS) were measured by incubation with Mito-SOX Red. (D) The expression of apoptosis-related proteins was measured by western blotting. (E) The effects of ZLN005 on cisplatin-induced apoptosis were determined by flow cytometry. (F) ATP levels were measured by using an ATP Assay kit. Data are provided as the mean ± SEM, n=3 independent experiments. *P < 0.05, **P < 0.01, ***P < 0.001 vs. Con; &P < 0.05, &&P < 0.01 vs. Cisp; #P < 0.05, ##P < 0.01 vs. sitfeb. (Con, control; Zln, ZLN005; Cisp, cisplatin; C+Z, cisplatin + ZLN005).
Figure 9
Figure 9
ZLN005 treatment alleviates renal injury in cisplatin-induced AKI mice via PGC-1a/TFEB pathway. The male C57BL/6 mice were injected once with cisplatin (16mg/kg, i.p.) to induce AKI, followed by ZLN005 treatment (15mg/kg/d, i.g.) for 4 days. (A) Western blots of TFEB, P62 and LC3 levels in kidney. (B) Representative TEM micrographs of mouse renal tubular epithelial cell mitochondria from each group. Scale bar, 2 μm (wireframe indicates the magnified image). (C) The expression of mitochondria-related proteins (ATP5b and Ndufs4) was measured by western blotting. (D) For the measurement of mitochondrial ROS (mtROS), frozen sections of freshly renal tissues were stained with Mito-SOX Red (2.5 μM) 15 min at 37° C and determined by confocal microscope. Scar bar: 20 μm. Data are provided as the mean ± SEM, n=3 independent experiments. *P < 0.05, **P < 0.01 vs. Con; &P < 0.05, &&P < 0.01 vs. Cisp. (NC, normal control; Cisp, cisplatin; C+Z, cisplatin + ZLN005).

Similar articles

Cited by

References

    1. Gonsalez SR, Cortês AL, Silva RC, Lowe J, Prieto MC, Silva Lara LD. Acute kidney injury overview: from basic findings to new prevention and therapy strategies. Pharmacol Ther. 2019; 200:1–12. 10.1016/j.pharmthera.2019.04.001 - DOI - PMC - PubMed
    1. Zuk A, Bonventre JV. Acute kidney injury. Annu Rev Med. 2016; 67:293–307. 10.1146/annurev-med-050214-013407 - DOI - PMC - PubMed
    1. Sánchez-González PD, López-Hernández FJ, López-Novoa JM, Morales AI. An integrative view of the pathophysiological events leading to cisplatin nephrotoxicity. Crit Rev Toxicol. 2011; 41:803–21. 10.3109/10408444.2011.602662 - DOI - PubMed
    1. Neamatallah T, El-Shitany NA, Abbas AT, Ali SS, Eid BG. Honey protects against cisplatin-induced hepatic and renal toxicity through inhibition of NF-κB-mediated COX-2 expression and the oxidative stress dependent BAX/Bcl-2/caspase-3 apoptotic pathway. Food Funct. 2018; 9:3743–54. 10.1039/c8fo00653a - DOI - PubMed
    1. Barabas K, Milner R, Lurie D, Adin C. Cisplatin: a review of toxicities and therapeutic applications. Vet Comp Oncol. 2008; 6:1–18. 10.1111/j.1476-5829.2007.00142.x - DOI - PubMed

Publication types

MeSH terms

Substances

LinkOut - more resources