

Place and Underlying Cause of Death During the COVID-19 Pandemic: Retrospective Cohort Study of 3.5 Million Deaths in England and Wales, 2014 to 2020
- PMID: 33714592
- PMCID: PMC7885692
- DOI: 10.1016/j.mayocp.2021.02.007
Place and Underlying Cause of Death During the COVID-19 Pandemic: Retrospective Cohort Study of 3.5 Million Deaths in England and Wales, 2014 to 2020
Abstract
Objective: To describe the place and cause of death during the coronavirus disease 2019 (COVID-19) pandemic to assess its impact on excess mortality.
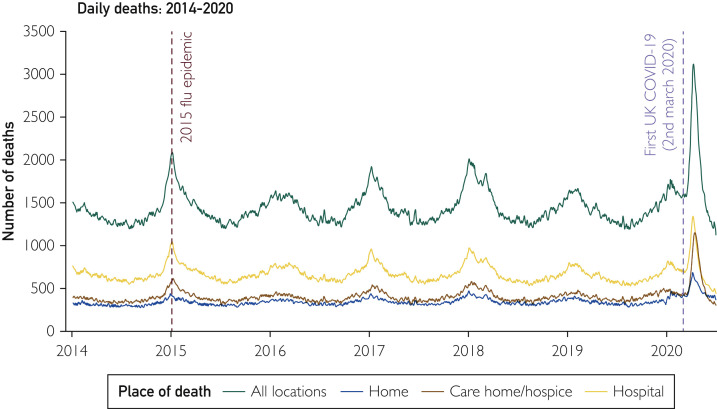
Methods: This national death registry included all adult (aged ≥18 years) deaths in England and Wales between January 1, 2014, and June 30, 2020. Daily deaths during the COVID-19 pandemic were compared against the expected daily deaths, estimated with use of the Farrington surveillance algorithm for daily historical data between 2014 and 2020 by place and cause of death.
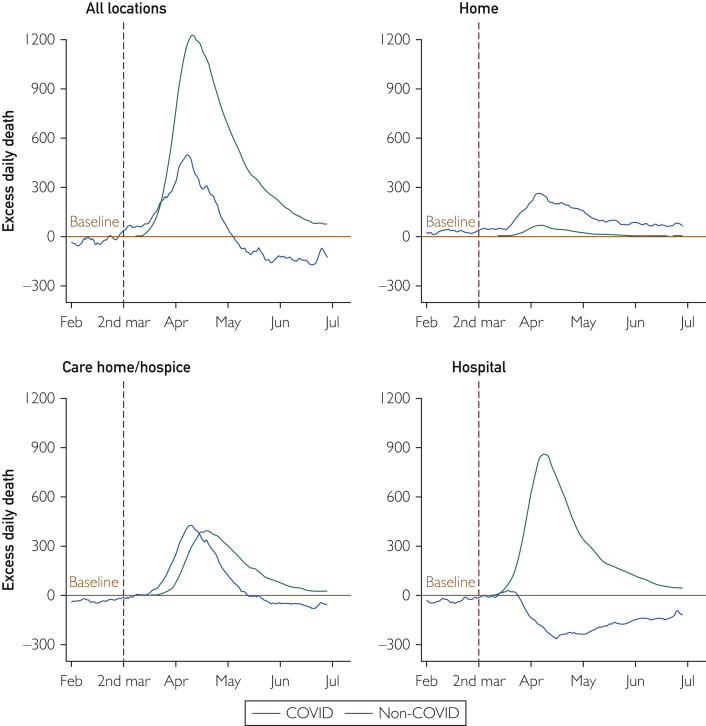
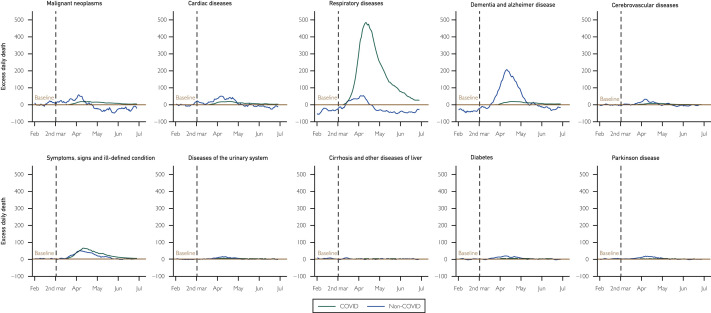
Results: Between March 2 and June 30, 2020, there was an excess mortality of 57,860 (a proportional increase of 35%) compared with the expected deaths, of which 50,603 (87%) were COVID-19 related. At home, only 14% (2267) of the 16,190 excess deaths were related to COVID-19, with 5963 deaths due to cancer and 2485 deaths due to cardiac disease, few of which involved COVID-19. In care homes or hospices, 61% (15,623) of the 25,611 excess deaths were related to COVID-19, 5539 of which were due to respiratory disease, and most of these (4315 deaths) involved COVID-19. In the hospital, there were 16,174 fewer deaths than expected that did not involve COVID-19, with 4088 fewer deaths due to cancer and 1398 fewer deaths due to cardiac disease than expected.
Conclusion: The COVID-19 pandemic has resulted in a large excess of deaths in care homes that were poorly characterized and likely to be the result of undiagnosed COVID-19. There was a smaller but important and ongoing excess in deaths at home, particularly from cancer and cardiac disease, suggesting public avoidance of hospital care for non-COVID-19 conditions.
Copyright © 2021 Mayo Foundation for Medical Education and Research. Published by Elsevier Inc. All rights reserved.
Figures
References
-
- World Health Organization WHO coronavirus disease (COVID-19) dashboard. https://covid19.who.int/
-
- Coronavirus tracked: see how your country compares. https://ig.ft.com/coronavirus-chart/?areas=usa&areas=gbr&areas=bra&areas...
-
- Deaths involving COVID-19, England and Wales: deaths occurring in May 2020. https://www.ons.gov.uk/peoplepopulationandcommunity/birthsdeathsandmarri... Accessed August 6, 2020.
Publication types
MeSH terms
Grants and funding
LinkOut - more resources
Full Text Sources
Other Literature Sources
Medical
