. 2021 May:363:104317.
doi: 10.1016/j.cellimm.2021.104317. Epub 2021 Mar 1.

Human splenic myeloid derived suppressor cells: Phenotypic and clustering analysis

Affiliations

Human splenic myeloid derived suppressor cells: Phenotypic and clustering analysis

Kathryn E Cole et al. Cell Immunol. 2021 May.

Abstract

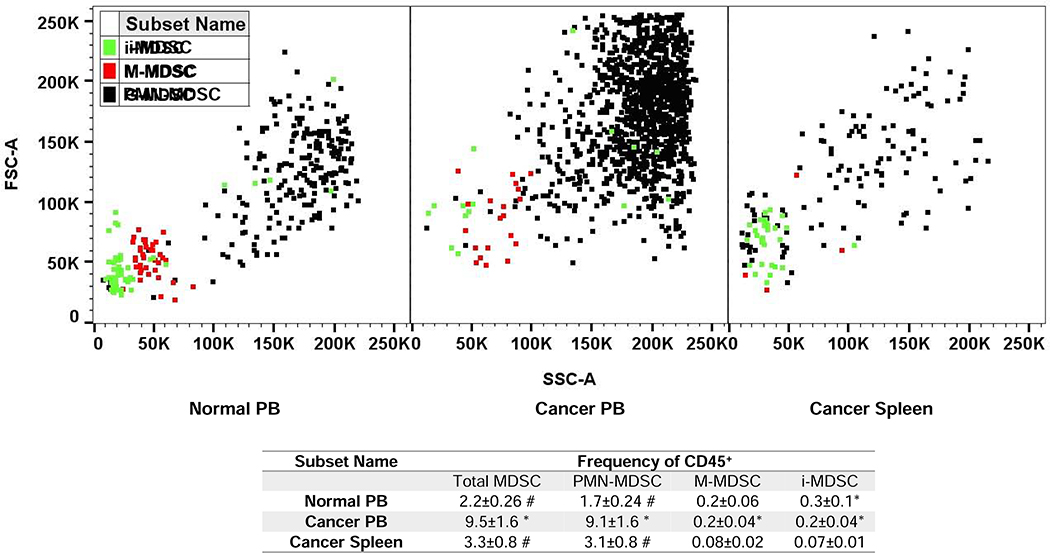
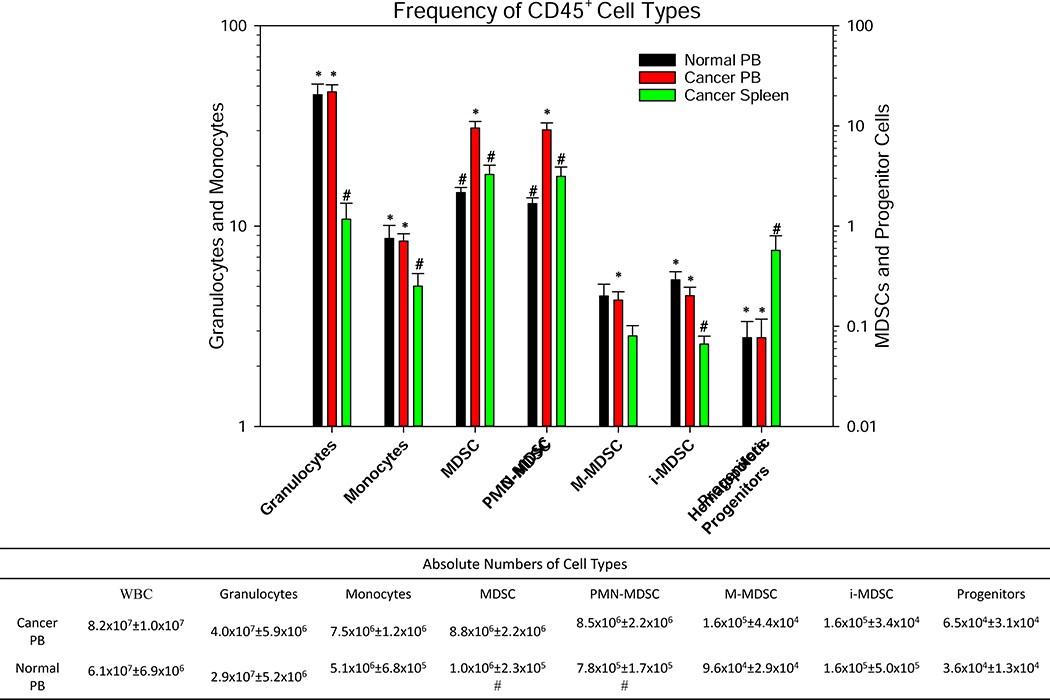
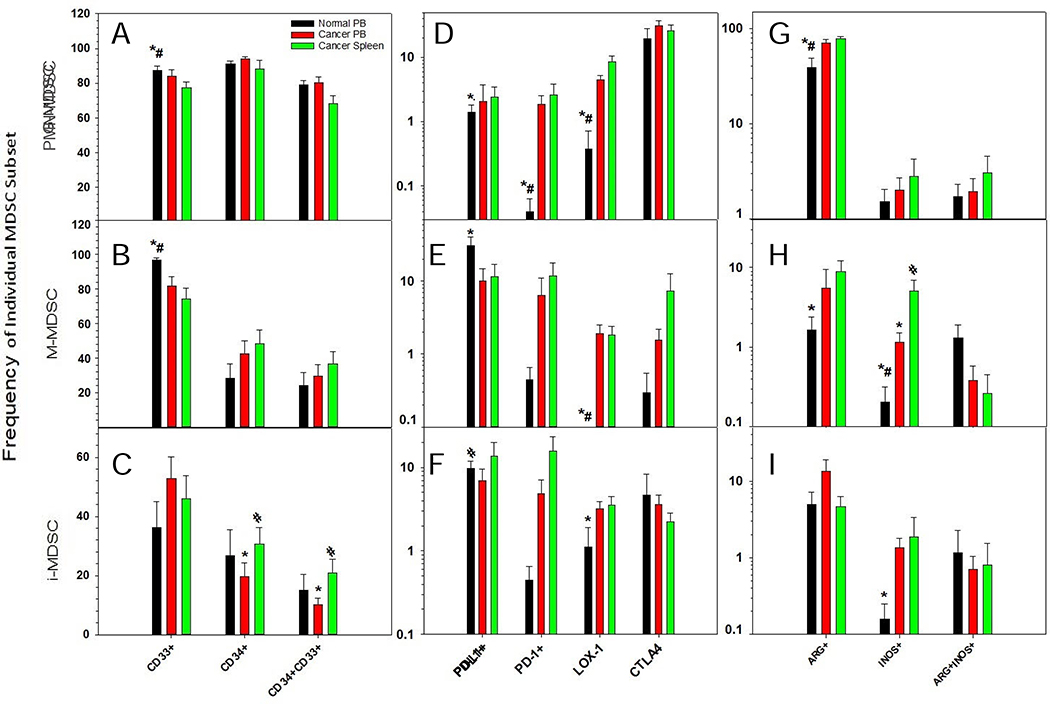
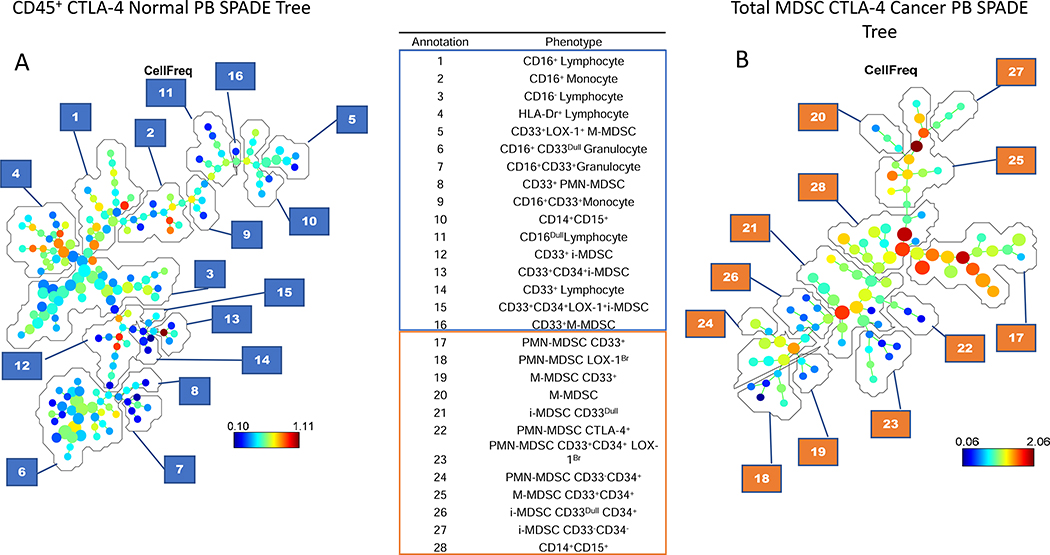
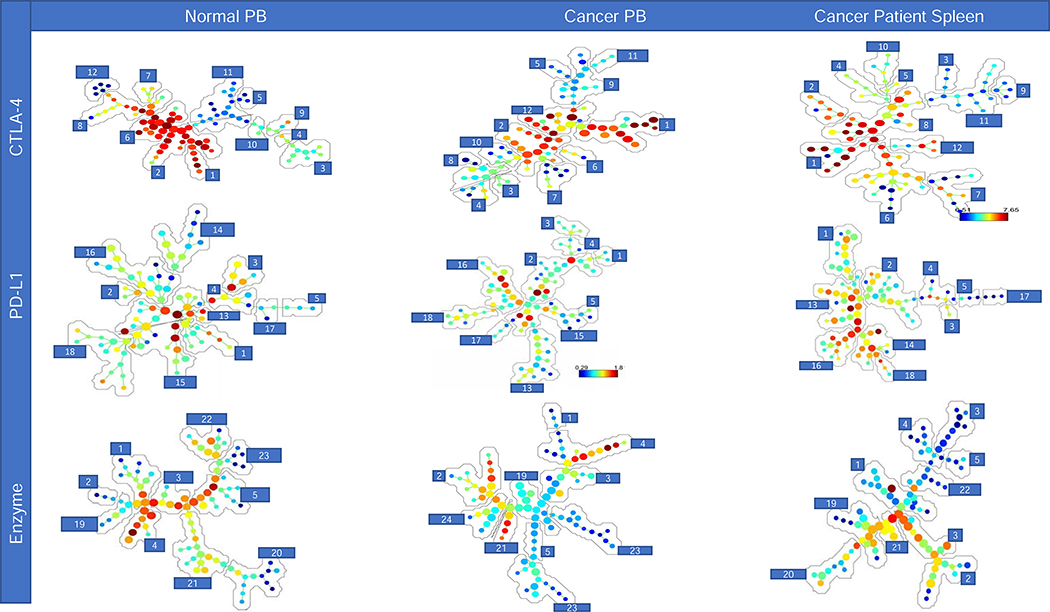
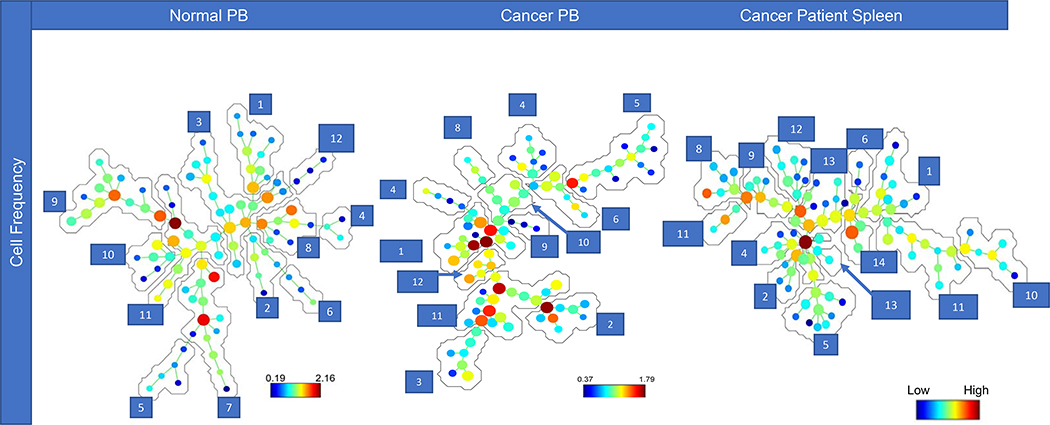
Myeloid derived suppressor cells (MDSCs) can be subset into monocytic (M-), granulocytic (G-) or polymorphonuclear (PMN-), and immature (i-) or early MDSCs and have a role in many disease states. In cancer patients, the frequencies of MDSCs can positively correlate with stage, grade, and survival. Most clinical studies into MDSCs have been undertaken with peripheral blood (PB); however, in the present studies, we uniquely examined MDSCs in the spleens and PB from patients with gastrointestinal cancers. In our studies, MDSCs were rigorously subset using the following markers: Lineage (LIN) (CD3, CD19 and CD56), human leukocyte antigen (HLA)-DR, CD11b, CD14, CD15, CD33, CD34, CD45, and CD16. We observed a significantly higher frequency of PMN- and M-MDSCs in the PB of cancer patients as compared to their spleens. Expression of the T-cell suppressive enzymes arginase (ARG1) and inducible nitric oxide synthase (i-NOS) were higher on all MDSC subsets for both cancer patients PB and spleen cells as compared to MDSCs from the PB of normal donors. Similar findings for the activation markers lectin-like oxidized low-density lipoprotein receptor-1 (LOX-1), program death ligand 1 (PD-L1) and program cell death protein 1 (PD-1) were observed. Interestingly, the total MDSC cell number exported to clustering analyses was similar between all sample types; however, clustering analyses of these MDSCs, using these markers, uniquely documented novel subsets of PMN-, M- and i-MDSCs. In summary, we report a comparison of splenic MDSC frequency, subtypes, and functionality in cancer patients to their PB by clustering and cytometric analyses.

Keywords: Cancer patient peripheral blood; Cancer patient spleen; Flow cytometry; MDSC; SPADE.


Figures

Figure 1.
Figure 1.. Comparison of MDSC frequency, size and granularity.
A graphical representation of granulocytic (G), monocytic (M), and immature (i) myeloid derived suppressor cells (MDSC) on an FSC-A x SSC-A plot for normal donor peripheral blood (PB), cancer patient PB, and cancer patient spleen cells. PMN-, M- and i-MDSCs are colored black, red, and green respectively. In the lower table MDSC frequencies are reported as the frequency of CD45+ cells The Benjamini-Hochberg (BH) procedure was used with a false discover rate of 0.05 to correct for multiple comparisons. Significance was determined by an independent T-test with BH adjusted p-value<0.05; * significant difference to cancer spleen, # significant difference to cancer PB.
Figure 2.
Figure 2.. Frequency of CD45+ Cell Types.
A comparison of cellular phenotypes reported as the frequency of CD45+ cells in cancer patients’ peripheral blood (PB), normal donors PB, and cancer patients’ spleens. Absolute numbers of the above cell populations for cancer and normal donor PB samples are shown in the lower table. Hematopoietic progenitor cells are defined as LinHLA-Dr−/lowCD11bCD14CD15CD16CD34+. The Benjamini-Hochberg (BH) procedure was used with a false discover rate of 0.05 to correct for multiple comparisons. Significance was determined by an independent T-test with BH adjusted p-value<0.05; * significant difference to cancer spleen, # significant difference to cancer PB.
Figure 3.
Figure 3.. Expression of activation, myeloid and functional markers on MDSCs.
Reported as the frequency of each individual MDSC subset, based on the expression of activation (D-F), myeloid (A-C), and functional markers (G-I). This is shown for PMN- (A,D,G), M- (B,E,H) and i-(C,F,I) MDSCs in normal peripheral blood (PB), cancer PB, and cancer patient’s spleen cells. The Benjamini-Hochberg (BH) procedure was used with a false discover rate of 0.05 to correct for multiple comparisons. Significance was determined by an independent T-test with BH adjusted p-value<0.05; * significant difference to cancer spleen, # significant difference to cancer PB.
Figure 4.
Figure 4.. SPADE tree analysis comparison in the peripheral blood.
SPADE tree comparisons of CD45+ cells versus total MDSC populations. The comparison used total CD45+ cells from a normal donor as a standard cellular source, while the MDSCs were from the peripheral blood (PB) of a cancer patient as a source rich in MDSCs. Annotations of the selected cell populations is shown for SPADE trees from the PB of normal donors and cancer patients. Annotations 1–16 are the CD45+ cells from normal PB, identifying 6 MDSC subpopulations. Annotations 17–28 are representative of the 11 MDSC subpopulations identified in the total MDSC population in the PB of cancer patients.
Figure 5.
Figure 5.. SPADE analysis of each sample type and panel.
SPADE trees and annotations for the peripheral blood (PB) of normal donors and cancer patients, and cancer patients spleens for all three flow panels (CTLA-4, PD-L1, and enzyme); reported as cell frequency from exported total MDSC population. Annotations 1–5 are representative of cell clusters consistently found for all sample types (Table 3). Annotations 6–12, 13–18, and 19–24 (Table 4) are representative of MDSC subpopulations identified in each sample type and source for flow panels CTLA-4, PD-L1, and enzyme respectively.
Figure 6.
Figure 6.. CytoBackBone Analysis.
SPADE trees generated post merging of the CTLA-4 and PD-L1 flow panels using the CytoBackBone algorithm for the peripheral blood (PB) of normal donors, and the spleen cells and PB of cancer patients; reported as cell frequency of the exported total MDSC populations. Annotations 1–4 are representative of clusters consistently identified in all sample types and sources (Table 5). Annotations 5–12, 13–20, and 21–30 are representative of MDSC subpopulations identified in the PB of normal donors, and the PB and spleen cells of cancer patients, respectively (Table 5).

References

    1. Wang L, Chang EW, Wong SC, Ong SM, Chong DQ, Ling KL, Increased myeloid-derived suppressor cells in gastric cancer correlate with cancer stage and plasma S100A8/A9 proinflammatory proteins, Journal of immunology, 190 (2013) 794–804. - PubMed
    1. Diaz-Montero CM, Salem ML, Nishimura MI, Garrett-Mayer E, Cole DJ, Montero AJ, Increased circulating myeloid-derived suppressor cells correlate with clinical cancer stage, metastatic tumor burden, and doxorubicin-cyclophosphamide chemotherapy, Cancer Immunol Immunother, 58 (2009) 49–59. - PMC - PubMed
    1. Gabitass RF, Annels NE, Stocken DD, Pandha HA, Middleton GW, Elevated myeloid-derived suppressor cells in pancreatic, esophageal and gastric cancer are an independent prognostic factor and are associated with significant elevation of the Th2 cytokine interleukin-13, Cancer Immunol Immunother, 60 (2011) 1419–1430. - PMC - PubMed
    1. Young MRI, Wright MA, Lozano Y, Prechel MM, Benefield J, Leonetti JP, Collins SL, Petruzzelli GJ, Increased recurrence and metastasis in patients whose primary head and neck squamous cell carcinomas secreted granulocyte-macrophage colony-stimulating factor and contained CD34+ natural suppressor cells, International Journal of Cancer, 74 (1997) 69–74. - PubMed
    1. Slavin S, Strober S, Induction of allograft tolerance after total lymphoid irradiation (TLI): development of suppressor cells of the mixed leukocyte reaction (MLR) Journal of immunology, 123 (1979) 942–946. - PubMed

Publication types

MeSH terms