. 2021 Mar 13;11(3):57.
doi: 10.1038/s41408-021-00436-0.

The multi-kinase inhibitor TG02 induces apoptosis and blocks B-cell receptor signaling in chronic lymphocytic leukemia through dual mechanisms of action

Affiliations

The multi-kinase inhibitor TG02 induces apoptosis and blocks B-cell receptor signaling in chronic lymphocytic leukemia through dual mechanisms of action

Rong Chen et al. Blood Cancer J. .

Abstract

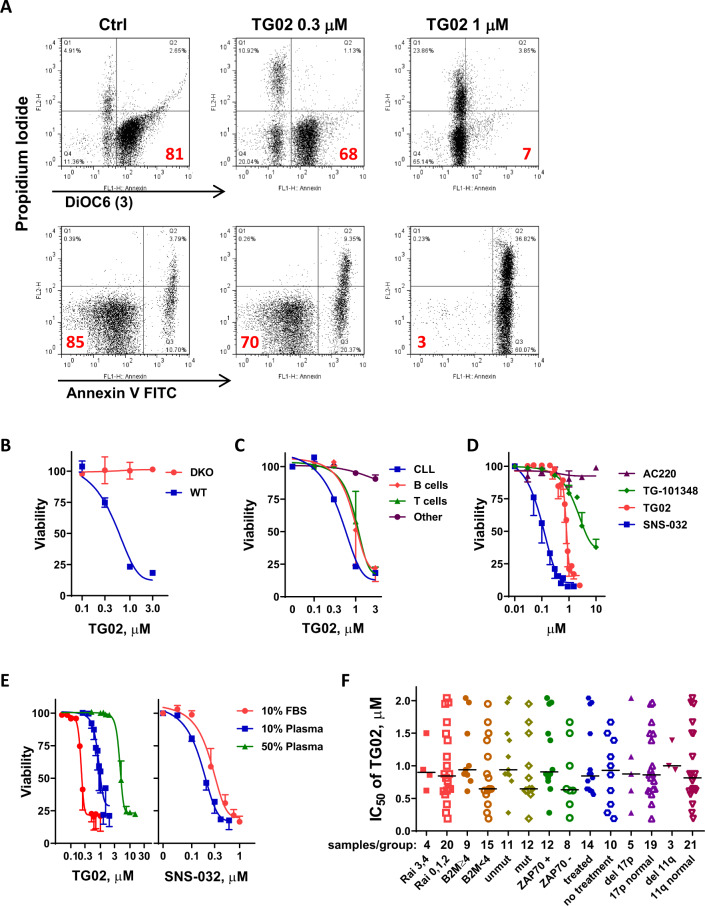
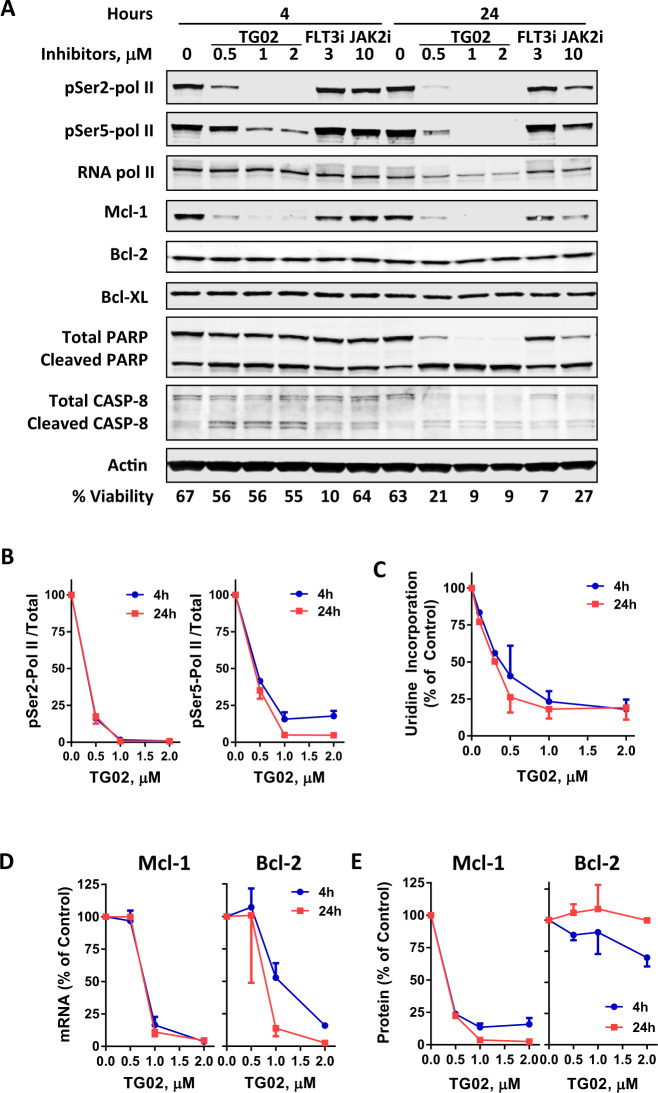
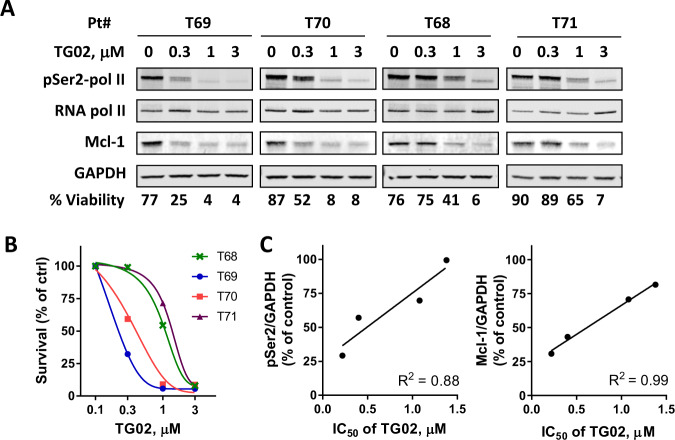
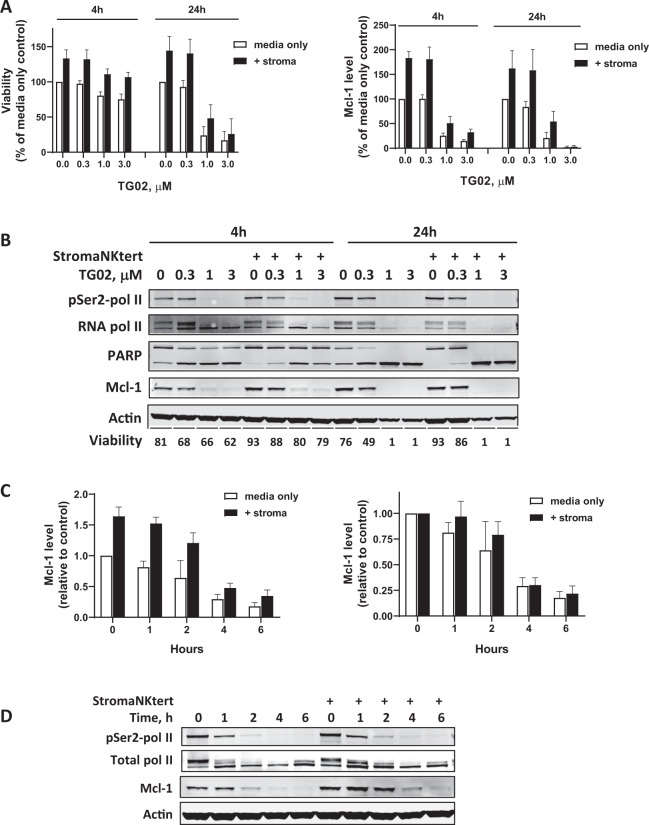
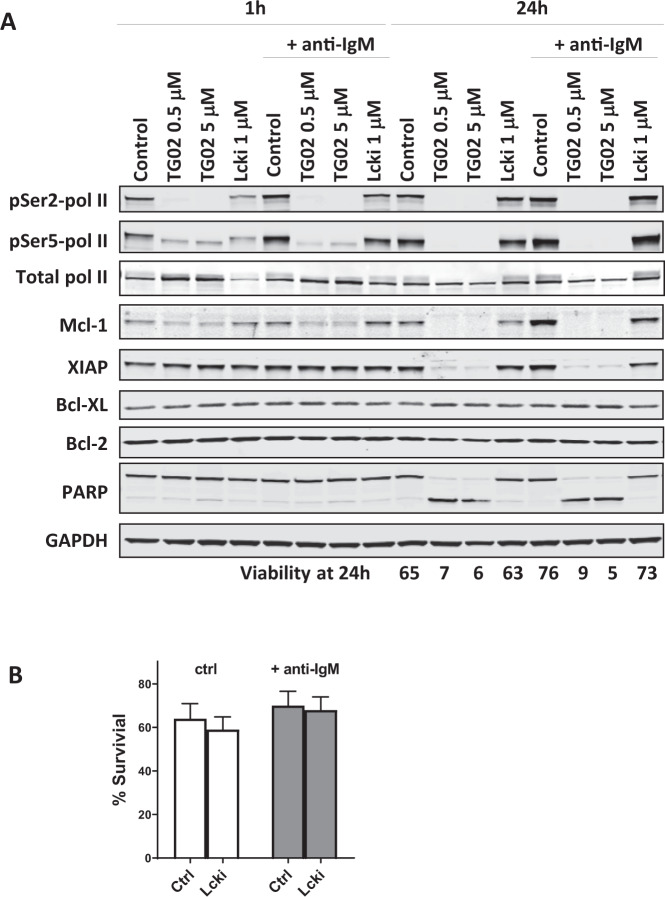
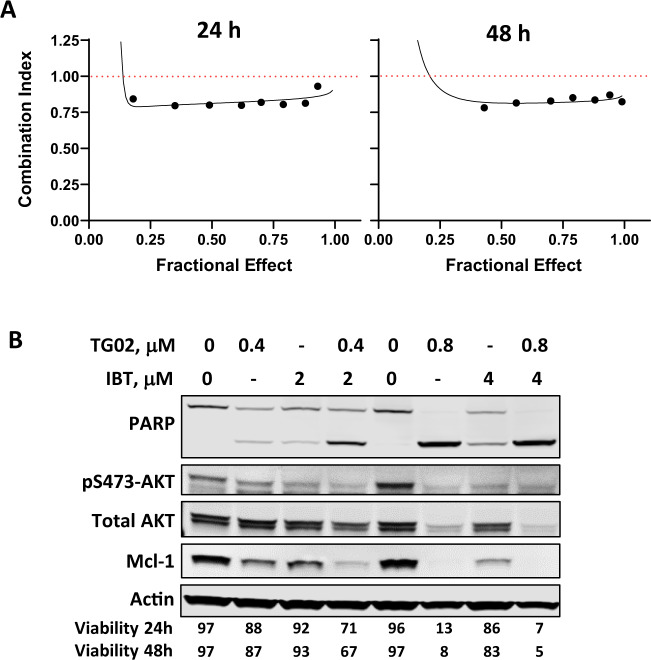
The constitutive activation of B-cell receptor (BCR) signaling, together with the overexpression of the Bcl-2 family anti-apoptotic proteins, represents two hallmarks of chronic lymphocytic leukemia (CLL) that drive leukemia cell proliferation and sustain their survival. TG02 is a small molecule multi-kinase inhibitor that simultaneously targets both of these facets of CLL pathogenesis. First, its inhibition of cyclin-dependent kinase 9 blocked the activation of RNA polymerase II and transcription. This led to the depletion of Mcl-1 and rapid induction of apoptosis in the primary CLL cells. This mechanism of apoptosis was independent of CLL prognostic factors or prior treatment history, but dependent on the expression of BAX and BAK. Second, TG02, which inhibits the members of the BCR signaling pathway such as Lck and Fyn, blocked BCR-crosslinking-induced activation of NF-κB and Akt, indicating abrogation of BCR signaling. Finally, the combination of TG02 and ibrutinib demonstrated moderate synergy, suggesting a future combination of TG02 with ibrutinib, or use in patients that are refractory to the BCR antagonists. Thus, the dual inhibitory activity on both the CLL survival pathway and BCR signaling identifies TG02 as a unique compound for clinical development in CLL and possibly other B cell malignancies.


Conflict of interest statement

F.J.B. was employed by Tragara Pharmaceuticals. All other authors declare no competing interests.

Figures

Fig. 1
Fig. 1. TG02-induced apoptosis in the primary CLL cells.
A TG02-induced loss of mitochondrial membrane potential and apoptosis in the CLL cells. A representative flow image is shown. Top panel: Loss of mitochondrial membrane potential measured by DiOC6(3) and PI double staining, numbers in the lower right quadrant indicate percentage of cells that have intact mitochondrial membrane; Bottom Panel: Analysis of apoptosis by annexin V-FITC/PI double staining. The percentages of live cells (Annexin-/PI-) are shown in the lower-left quadrant. B TG02-induced cell death was dependent on BAX/BAK expression. The cytotoxicity of TG02 at 24 h was compared between wild-type MEF cells (◾) and cells with BAX and BAK double knockout (●). Cell death was measured by Annexin V/PI staining followed by flow cytometry and normalized to DMSO-treated controls. Data represent the mean ± SD of measurements performed in triplicates. C Comparison of TG02 toxicity for CLL cells relative to normal B and T cells from healthy donors. Cell death (mean ± SEM) was compared after 24 h incubation with TG02 in CLL cells (n = 3,◾) and normal B cells (♦), T cells (▴) cells and other cells (neither B nor T, ●) from healthy donors (n = 3). D Dose-dependent induction of cell death was compared among SNS-032 (◾, n = 6), TG02 (●, n = 10), TG-101348 (♦, n = 7) and AC220 (▴, n = 3) after 24 h incubation. Data represent the mean ± SEM. E. Plasma proteins reduced the potency of TG02. Left: the dose responses to TG02 at 24 h were compared in CLL cells incubated in RPMI with 10% FBS (●), 10% human plasma (◾) or 50% human plasma (▴). As a control, the dose responses to SNS-032 were compared in 10% FBS (●) or 10% human plasma (◾) (right). Data represent the mean viability ± SEM of 3 samples. F. Toxicity of TG02 is independent of CLL prognostic factors. IC50 values of TG02 after 24 h incubation were compared in 24 CLL samples with either inferior or favorable prognosis, or previous treatment history. The line in the scatter plot showed median IC50 values of each group. The number of samples in each group was shown below the plot. None of the comparisons was significant according to Mann–Whitney test (p values greater than 0.05).
Fig. 2
Fig. 2. TG02 reduced the phosphorylation of RNA pol II, inhibited RNA synthesis and reduced Mcl-1 levels in CLL cells.
A A representative immunoblot (n = 3) of the phosphorylation status of the Ser2 and Ser5 sites of RNA pol II CTD, Mcl-1, Bcl-2, Bcl-XL, and PARP in the CLL cells after a 4 and 24 h incubation with TG02 at 0.5, 1, and 2 μM, sunitinib (FLT3i) at 3 μM and TG-101348 (JAK2i) at 10 μM. Actin was used as a loading control. Cell viability was shown at the bottom of the blots. B Quantitation of the immunoblots of RNA pol II phosphorylation (Ser2, left; Ser5, right) at 4 h (●) and 24 h (◾) from 3 different CLL samples. Levels of phosphorylation were normalized to total RNA pol II and presented as percentage (mean ± SEM) of controls. C TG02 inhibited RNA synthesis in CLL cells. CLL cells were incubated with TG02 for 4 h (●) and 24 h (◾) and [3H]uridine incorporation was measured as described in “Methods”. The DPM values were normalized to time-matched controls and presented as mean ± SEM from three samples. D TG02 reduced the mRNAs of Mcl-1 (left) and Bcl-2 (right) in CLL cells after 4 h (●) and 24 h (◾) of incubation with TG02. E Quantitation of Mcl-1 and Bcl-2 proteins after 4 h (●) and 24 h (◾) of incubation with TG02 from three different CLL samples. Data were presented as percentage (mean ± SEM, n = 3) of controls.
Fig. 3
Fig. 3. CLL sensitivity to TG02 correlated to its inhibition of CDK9 and reduction of Mcl-1.
A Immunoblots of pSer2 and total RNA pol II, Mcl-1 after 4 h incubation with TG02 in four CLL samples that varied in their sensitivity to TG02. Cell viabilities after 24 h incubation with TG02 were shown at the bottom of the blots. B Dose response of the 4 CLL samples to TG02 measured at 24 h. C TG02 IC50 correlated to the inhibition of RNA pol II phosphorylation and reduction of Mcl-1. PSer2-pol II and Mcl-1 level levels (at 0.3 μM TG02) were quantitated from the immunoblots, normalized to GAPDH, calculated as percentage of controls and correlated to the IC50s of TG02. R squared values were generated by linear regression.
Fig. 4
Fig. 4. TG02 reduced Mcl-1 and induced apoptosis in the CLL cells at the presence of stroma protection.
A TG02 overcame stroma cell protection. CLL cells were cultured in RPMI media supplemented with 10% autologous plasma, either alone (media only, white bars), or co-culture with a layer of StromaNKtert cells (+stroma, black bars) overnight. Then the cells were incubated with increasing concentrations of TG02 and viabilities were analyzed by Annexin V/PI double staining after 4 and 24 h incubation (left), and Mcl-1 expression were quantitated by immunoblotting (right). Data present percentage of media only controls (mean ± SEM) of four individual CLL samples. B A representative immunoblot of cells incubated in conditions described in A. C Mcl-1 expression was induced by co-culturing with the StromaNKtert cells, which was reduced by TG02. CLL cells were cultured in RPMI media supplemented with 10% autologous plasma, either alone (media only, white bars), or co-culture with a layer of StromaNKtert cells (+stroma, black bars) overnight. Then the cells were incubated 1 μM TG02. Cell pellets were collected at 0, 1, 2, 4, and 6 h. Phosphorylation of RNA pol II and expression of Mcl-1 were analyzed by immunoblotting. Mcl-1 levels were quantitated in these samples and presented as levels relevant to media only control (left) and relevant to untreated controls (right) (mean ± SEM, n = 4). D A representative immunoblot of cells incubated in conditions described in (C).
Fig. 5
Fig. 5. TG02 blocked BCR signaling in the CLL cells.
A CLL cells were cultured in RPMI media supplemented with 10% autologous plasma, either alone or at the presence of anti-IgM. The cells were incubated with increasing concentrations of TG02 and viabilities were analyzed by Annexin V/PI double staining at the end of the 24 h incubation. Data represents mean ± SE of four CLL samples. B TG02 blocked BCR signaling-mediated activation of NF-κB. CLL cells were incubated with TG02 for 1 h before stimulating with anti-IgM for 2 h, and NF-κB p65 activation and inhibition were measured by chemiluminescence and presented as the percentage of control (mean ± SEM) of three samples. Black bars: with anti-IgM stimulation; white bars: no stimulation. WT Oligo and Mut Oligo represent the wild-type and mutated p65 consensus binding oligonucleotides that were used to confirm the specificity of the analysis. C The phosphorylation status of kinases in the BCR signaling pathway was analyzed by immunoblotting. GAPDH was used as loading control. CLL cells were incubated with TG02 or Lcki for 1 h before stimulating with anti-IgM for 1 h and 24 h. A representative immunoblot of three experiments is shown. D Inhibition of BCR signaling by TG02 was mediated by the inhibition of Lck and JAK2. CLL cells were incubated with TG02, Lcki, SNS-032, Sunitinib, or TG-101348 for 1 h before stimulating with anti-IgM for 1 h. The phosphorylation of Akt and ERK was evaluated by immunoblotting. A representative immunoblot of three experiments is shown.
Fig. 6
Fig. 6. BCR signaling activated RNA pol II and increased Mcl-1 levels; this was blocked by TG02.
A CLL cells were incubated with TG02 or Lcki for 1 h before stimulating with anti-IgM for 1 h and 24 h. The phosphorylation RNA pol II and the levels of anti-apoptotic proteins were evaluated by immunoblotting. The mean CLL cell viability of three individual experiments assessed at 24 h is shown below the image. B Inhibiting Lck had minimal toxicity on the CLL cells. CLL cells were incubated with Lcki for 1 h before stimulating with anti-IgM for 24 h. The percentage of surviving cells with or without Lcki was compared in groups without (white bars) and with (gray bars) anti-IgM stimulation (mean ± SEM, n = 8).
Fig. 7
Fig. 7. CLL cells after ibrutinib treatment remain sensitive to TG02.
A (top) The lymphocyte count of the CLL patient before (Pre) and 4 weeks after (W4) ibrutinib treatment. A (bottom) Dose response to TG02 in CLL cells pre- and post- ibrutinib treatment. CLL cells isolated from CLL patients pre- (Pre, ○) and 4 weeks (W4, •) post ibrutinib were incubated for 24 h with TG02, and cell death was measured by flow cytometry. B The IC50 values of TG02 pre- (○) and 4 weeks (•) post ibrutinib were compared by Wilcoxon paired test (n = 12). C Dose response to TG02 in cells from a CLL patient collected prior to ibrutinib treatment (Pre) and at the time of refractory (Refractory).
Fig. 8
Fig. 8. Moderate synergy in the combination of TG02 and ibrutinib.
A Representative median-effect cures of the combination of TG02 and ibrutinib at 24 h (left) and 48 h (right). Cells were incubated with TG02 and ibrutinib at a fixed ratio of 1:5. The representative results from 4 CLL samples were shown. B A representative immunoblot of the combinations of TG02 and ibrutinib (IBT) at two different doses. Cell viability at 24 and 48 h were shown below the blots.

Similar articles

Cited by

References

    1. Burger JA. Treatment of chronic lymphocytic leukemia. N. Engl. J. Med. 2020;383:460–473. doi: 10.1056/NEJMra1908213. - DOI - PubMed
    1. Chiorazzi N, Rai KR, Ferrarini M. Chronic lymphocytic leukemia. N. Engl. J. Med. 2005;352:804–815. doi: 10.1056/NEJMra041720. - DOI - PubMed
    1. Calissano C, et al. In vivo intraclonal and interclonal kinetic heterogeneity in B-cell chronic lymphocytic leukemia. Blood. 2009;114:4832–4842. doi: 10.1182/blood-2009-05-219634. - DOI - PMC - PubMed
    1. Kitada S, et al. Expression of apoptosis-regulating proteins in chronic lymphocytic leukemia: correlations with In vitro and In vivo chemoresponses. Blood. 1998;91:3379–3389. doi: 10.1182/blood.V91.9.3379. - DOI - PubMed
    1. Messmer BT, et al. In vivo measurements document the dynamic cellular kinetics of chronic lymphocytic leukemia B cells. J. Clin. Invest. 2005;115:755–764. doi: 10.1172/JCI23409. - DOI - PMC - PubMed

Publication types

MeSH terms

Substances