Temporal kinetics of bovine mammary IgG secretion into colostrum and transition milk
- PMID: 33715013
- PMCID: PMC8139318
- DOI: 10.1093/jas/skab083
Temporal kinetics of bovine mammary IgG secretion into colostrum and transition milk
Abstract
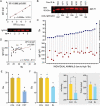
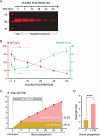
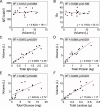
Neonatal calf survival and health is predominantly dependent on sufficient consumption of immunoglobulin G (IgG) and the resulting transfer of passive immunity (TPI). In this study, we investigate the potential for continued IgG secretion and temporal kinetics of mammary IgG output in sequential milkings performed at 0, 4, 16, 28, 40, and 52 hr postcalving in Holstein dairy cows. For colostrum (0 hr), we also scrutinize the relationships between IgG concentration, volume, refractometer readings (˚Bx values, Brix) and concentration of sugars (lactose and glucose). Mammary transcripts postpartum (0 hr) indicated that active IgG secretion continues beyond the first milking (colostrum; n = 4 to 5). IgG measurements at the different timepoints indicated that colostrum represents only 25.1% of the total IgG produced across the 6 sequential milking timepoints, with a substantial 48.9% being secreted into transition milk over the next 3 timepoints (4-, 6-, and 28-hr) combined. The differences on the basis of IgG concentrations across 0-, 4-, and 16-hr milking timepoints were not statistically significant (P = 0.1522; n = 9). For colostrum, volume remained highly variable, even with induced let-down prior to milking (n = 27). Nonetheless, colostrum IgG secretion was significantly co-regulated with volume (R2 = 0.915; P < 0.001; n = 18), an association that was stronger than that measured for lactose (R2 = 0.803; P < 0.001; n = 18) and glucose (R2 = 0.467; P = 0.002; n = 17). Comparing colostrum ˚Bx values to absolute IgG concentrations showed no correlation (R2 = 0.127; P = 0.07; n = 27); biochemical separation of colostrum components indicated that both proteins and nonprotein solutes could affect ˚Bx values (P < 0.0001 for both; n = 5). This suggests that ˚Bx values do not reasonably indicate IgG concentration to serve as a measure of "colostrum quality." Additionally, our finding that early transition milk (4-, 6-, and 28-hr) can contribute substantially more IgG than colostrum forces a rethink of existing feeding paradigms and means to maximize TPI in calves. Collectively, our results reveal the remarkable value of early transition milk and caveats to colostrum assessments that could advance application in enhancing neonatal calf health.
Keywords: calf; dairy; immunoglobulin; mammary; nutrition.
© The Author(s) 2021. Published by Oxford University Press on behalf of the American Society of Animal Science. All rights reserved. For permissions, please e-mail: journals.permissions@oup.com.
Figures


Comment in
-
Letter to the editor: Comments on Schalich et al. (2021), Colostrum testing with Brix is a valuable on-farm tool. doi.org/10.193/jas/skab083.J Anim Sci. 2022 Apr 1;100(4):skac119. doi: 10.1093/jas/skac119. J Anim Sci. 2022. PMID: 35483037 Free PMC article. No abstract available.
Similar articles
-
Pattern of milk yield and immunoglobulin concentration and factors associated with colostrum quality at the quarter level in dairy cows after parturition.J Dairy Sci. 2020 Jan;103(1):965-971. doi: 10.3168/jds.2019-17283. Epub 2019 Oct 24. J Dairy Sci. 2020. PMID: 31668447
-
Colostrum source and passive immunity transfer in dairy bull calves.J Dairy Sci. 2021 Jul;104(7):8164-8176. doi: 10.3168/jds.2020-19318. Epub 2021 Apr 15. J Dairy Sci. 2021. PMID: 33865574
-
Peripartal progesterone and prolactin have little effect on the rapid transport of immunoglobulin G into colostrum of dairy cows.J Dairy Sci. 2014 May;97(5):2923-31. doi: 10.3168/jds.2013-7795. Epub 2014 Mar 13. J Dairy Sci. 2014. PMID: 24630658 Clinical Trial.
-
Review: passive immunity in beef-suckler calves.Animal. 2019 Apr;13(4):810-825. doi: 10.1017/S1751731118003026. Epub 2018 Nov 21. Animal. 2019. PMID: 30458893 Review.
-
Invited review: The importance of colostrum in the newborn dairy calf.J Dairy Sci. 2022 Apr;105(4):2733-2749. doi: 10.3168/jds.2020-20114. Epub 2022 Jan 28. J Dairy Sci. 2022. PMID: 35094859 Review.
Cited by
-
Chemometric Approaches to Analyse the Composition of a Ewe's Colostrum.Animals (Basel). 2023 Mar 8;13(6):983. doi: 10.3390/ani13060983. Animals (Basel). 2023. PMID: 36978524 Free PMC article.
-
Letter to the editor: Comments on Schalich et al. (2021), Colostrum testing with Brix is a valuable on-farm tool. doi.org/10.193/jas/skab083.J Anim Sci. 2022 Apr 1;100(4):skac119. doi: 10.1093/jas/skac119. J Anim Sci. 2022. PMID: 35483037 Free PMC article. No abstract available.
-
Comparison of turbidometric immunoassay and brix refractometry to radial immunodiffusion for assessment of colostral immunoglobulin concentration in beef cattle.J Vet Intern Med. 2023 Sep-Oct;37(5):1934-1943. doi: 10.1111/jvim.16833. Epub 2023 Aug 19. J Vet Intern Med. 2023. PMID: 37596893 Free PMC article.
-
Evaluation of Colostrum Components and Milking Status Affecting Colostrum IgG Concentration.Animals (Basel). 2025 Mar 3;15(5):718. doi: 10.3390/ani15050718. Animals (Basel). 2025. PMID: 40076000 Free PMC article.
-
Contradictions on colostrum IgG levels and Brix values are real and can be explained. Response to letter by Lombard et al. (2022).J Anim Sci. 2022 Apr 1;100(4):skac120. doi: 10.1093/jas/skac120. J Anim Sci. 2022. PMID: 35483038 Free PMC article. No abstract available.
References
-
- Beam, A. L., Lombard J. E., Kopral C. A., Garber L. P., Winter A. L., Hicks J. A., and Schlater J. L.. . 2009. Prevalence of failure of passive transfer of immunity in newborn heifer calves and associated management practices on US dairy operations. J. Dairy Sci. 92:3973–3980.. doi:10.3168/jds.2009-2225 - DOI - PubMed
MeSH terms
Substances
LinkOut - more resources
Full Text Sources
Other Literature Sources
Miscellaneous

