. 2022 May;16(9):1931-1946.
doi: 10.1002/1878-0261.12946. Epub 2021 Oct 12.

Exploring hTERT promoter methylation in cutaneous T-cell lymphomas

Affiliations

Exploring hTERT promoter methylation in cutaneous T-cell lymphomas

Alain Chebly et al. Mol Oncol. 2022 May.

Abstract

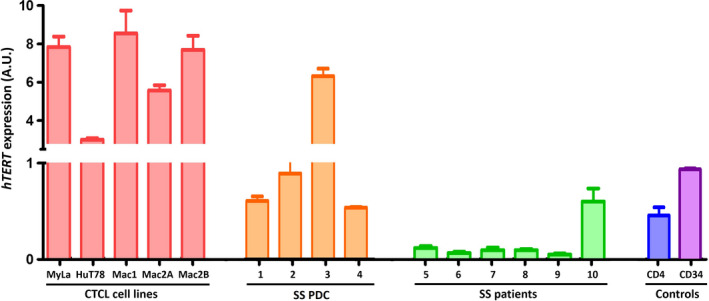
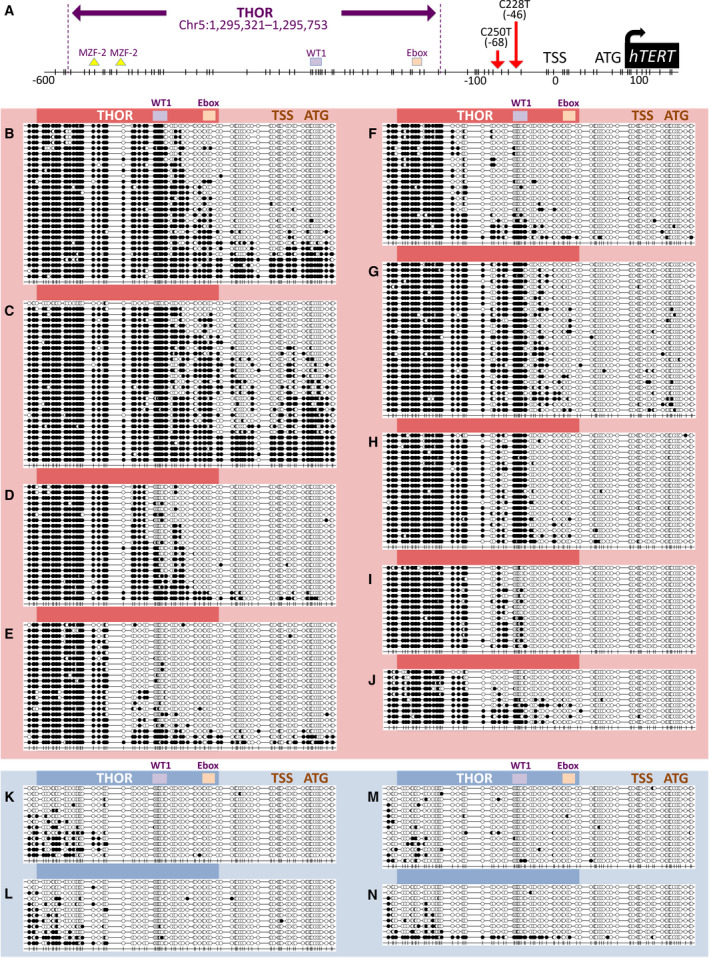
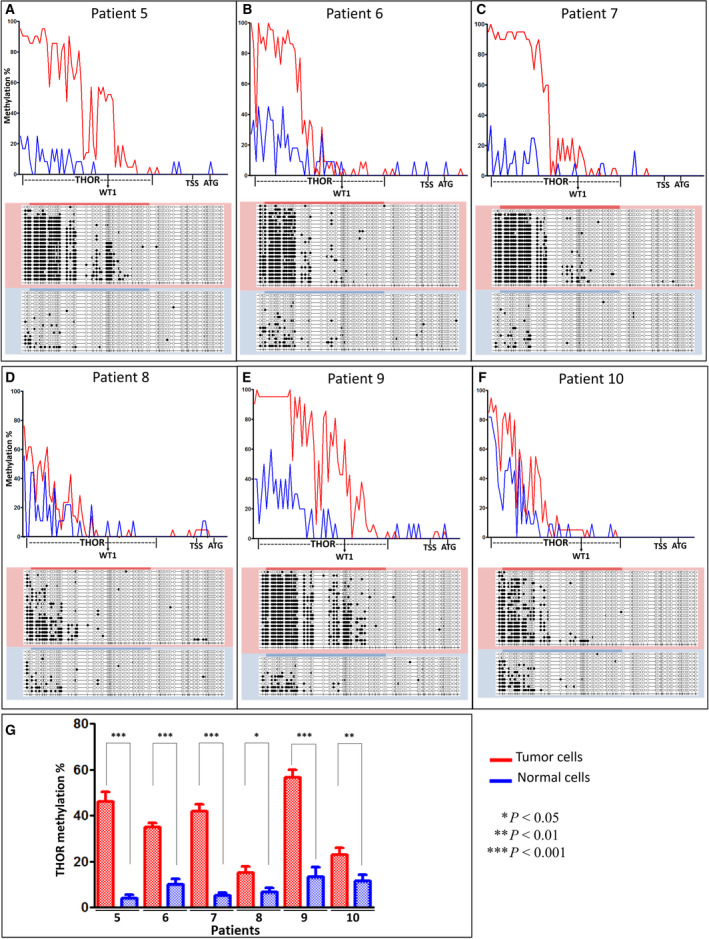
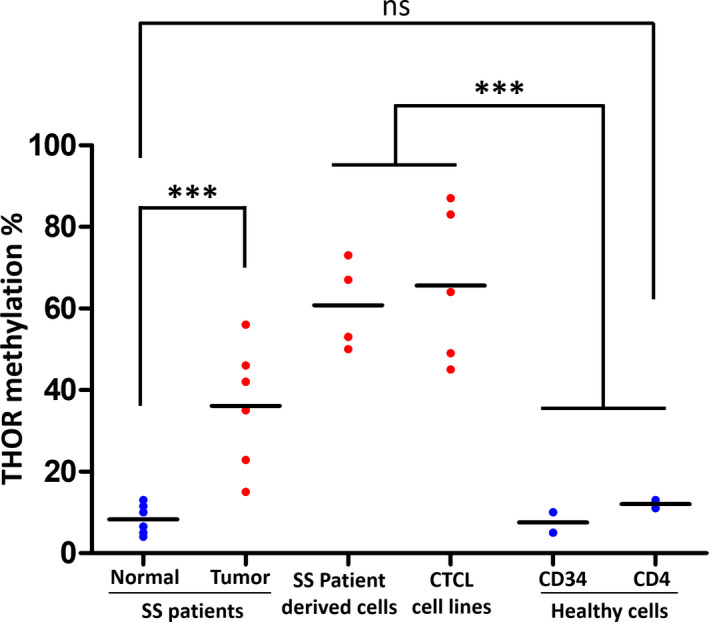
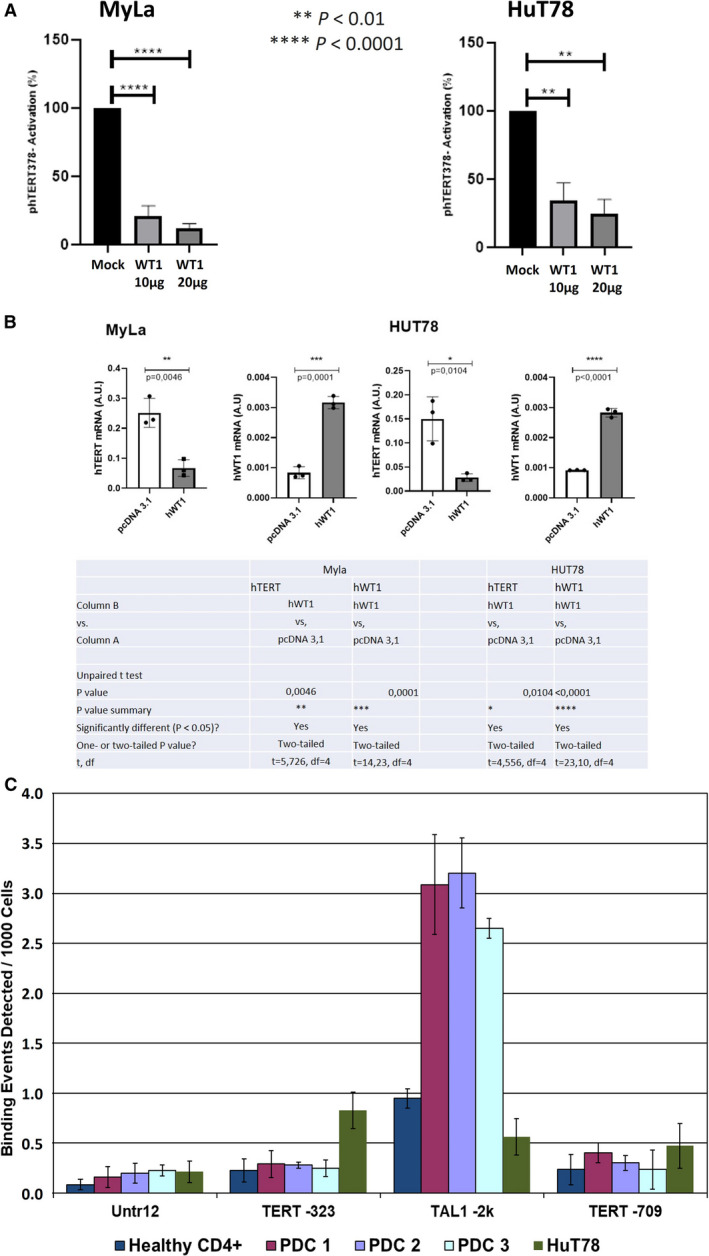
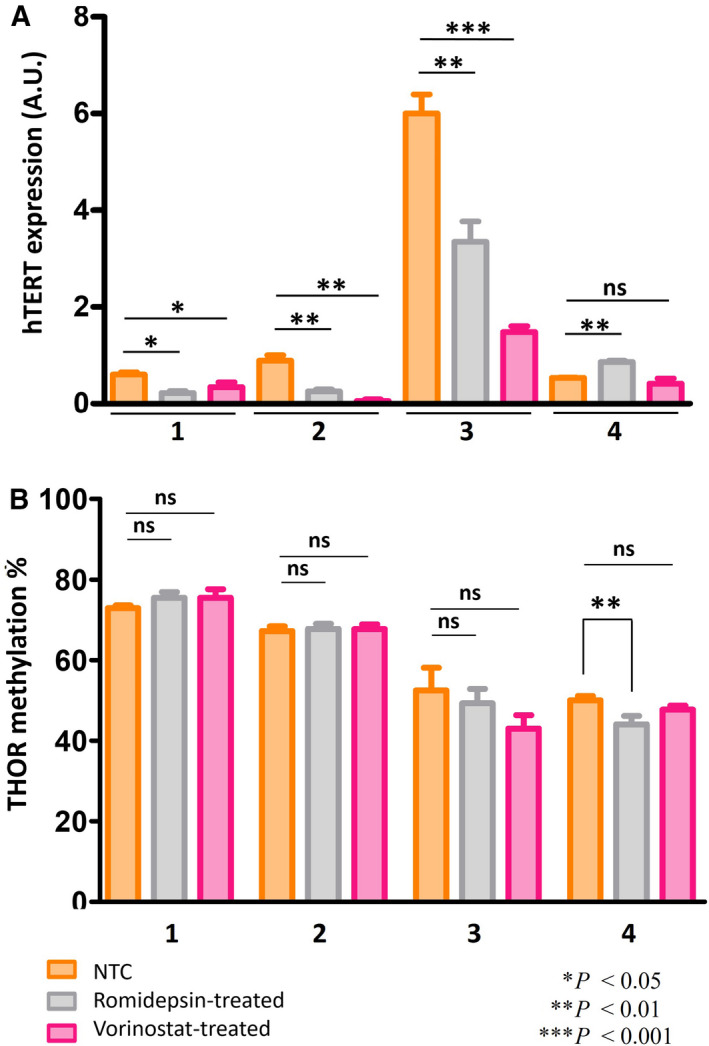
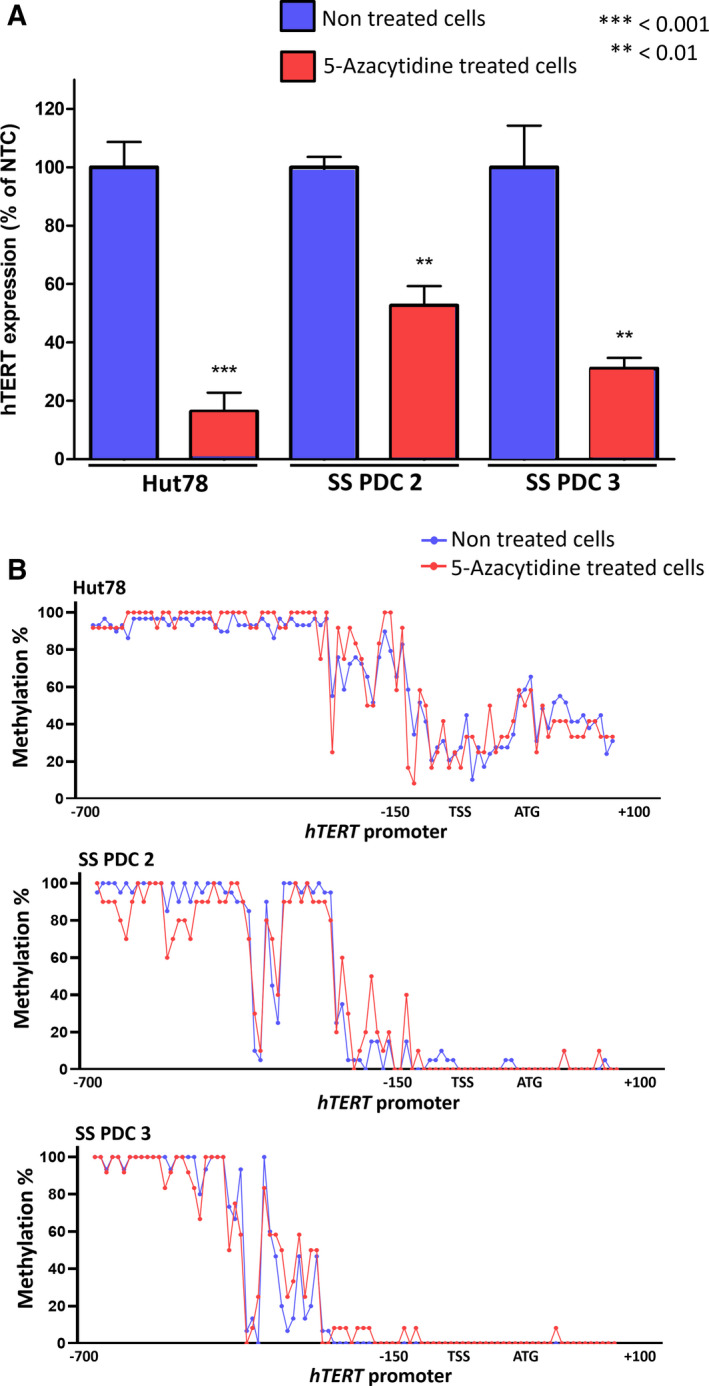
Cutaneous T-cell lymphomas (CTCLs) are telomerase-positive tumors expressing hTERT, although neither gene rearrangement/amplification nor promoter hotspot mutations could explain the hTERT re-expression. As the hTERT promoter is rich in CpG, we investigated the contribution of epigenetic mechanisms in its re-expression. We analyzed hTERT promoter methylation status in CTCL cells compared with healthy cells. Gene-specific methylation analyses revealed a common methylation pattern exclusively in tumor cells. This methylation pattern encompassed a hypermethylated distal region from -650 to -150 bp and a hypomethylated proximal region from -150 to +150 bp. Interestingly, the hypermethylated region matches with the recently named TERT hypermethylated oncogenic region (THOR). THOR has been associated with telomerase reactivation in many cancers, but it has so far not been reported in cutaneous lymphomas. Additionally, we assessed the effect of THOR on two histone deacetylase inhibitors (HDACi), romidepsin and vorinostat, both approved for CTCL treatment and a DNA methyltransferase inhibitor (DNMTi) 5-azacytidine, unapproved for CTCL. Contrary to our expectations, the findings reported herein revealed that THOR methylation is relatively stable under these epigenetic drugs' pressure, whereas these drugs reduced the hTERT gene expression.

Keywords: DNA methylation; DNMTi; HDACi; TERT; cutaneous T-cell lymphomas; telomerase.


Conflict of interest statement

The authors declare no conflict of interest.

Figures

Fig. 1
Fig. 1
hTERT expression in cell lines and patients' cells. hTERT mRNA levels quantified by fluorescence real‐time reverse transcriptase PCR in CTCL cell lines, in SS patient‐derived cells (SS PDCs), in SS patient cells (SS patients), and in healthy CD4+ and CD34+ cells. hTERT mRNA levels were normalized to the expression of the TBP gene and expressed in arbitrary unit (A.U) ± the SEM of three independent experiments. TBP: TATA‐box‐binding protein located on 6q27. n = three independent experiments.
Fig. 2
Fig. 2
hTERT gene promoter methylation including THOR in CTCL cells and healthy controls. (A) hTERT gene promoter including THOR (Chr5:1 295 321–1 295 753;GRCh37/hg19) containing 52 CpG represented each by a vertical dash. (B–N) Methylation profiles of CTCL cells (red) and controls (blue): Full black dots represent methylated CpGs, whereas empty dots represent unmethylated CpGs. For CTCL cell lines: MyLa is represented in (B), HuT78 in (C), Mac1 in (D), Mac2A in (E), and Mac2B in (F). For SS PDC: PDC 1 is represented in (G), PDC 2 in (H), PDC 3 in (I), and PDC 4 in (J). Healthy CD4+ controls: Two pools are represented in (K) and (L). Normal stem/progenitor cells: Two pools of normal CD34+ cells are represented in (M) and (N). n = three independent experiments.
Fig. 3
Fig. 3
hTERT gene promoter methylation including THOR in Sézary syndrome patient cells. Graphs (A) to (F) showing the difference between methylation profiles of tumor cells (red) and normal cells (blue), in patient 5 (A), patient 6 (B), patient 7 (C), patient 8 (D), patient 9 (E), and patient 10 (F). Chart (G) showing THOR methylation levels in tumor (red) and normal (blue) cells in each of the six SS patients' cells (±SEM). Statistical significances were determined by t‐test. THOR, TERT hypermethylated oncogenic region.
Fig. 4
Fig. 4
THOR methylation status. The difference in THOR methylation averages between normal cells in blue and tumor cells in red in all cells studied. This figure is a visual representation of THOR methylation in the previously mentioned CTCL cell lines, SS PDC, and SS patients. Statistical significances were determined by t‐test. n = three independent experiments.
Fig. 5
Fig. 5
Effect of the transcription factor WT1 on hTERT promoter in CTCL. Graph (A) presents the results of luciferase assay showing the effect of empty vector (mock), 10 and 20 µg of WT1 on hTERT promoter activation in HuT78 and MyLa cell lines. Graph and table (B) show the significant decrease in hTERT mRNA expression after the overexpression of WT1 in MyLa and HuT78. Graph (C) shows the results of ChIP‐qPCR using a WT1 antibody targeting the TERT‐323 region (region of interest) in SS PDCs 1, 2, and 3, HuT78, a SS cell line, and healthy CD4+ (control), along with a negative control (Untr12) region, and two positive control regions (TAL1‐2k and TERT‐709). The results for the TAL1‐2k region confirm the efficacy of the used WT1 primer. Statistical significances were determined by t‐test. n = three independent experiments. SS PDCs, Sézary syndrome patient‐derived cells; df, degrees of freedom.
Fig. 6
Fig. 6
HDACi treatments in Sézary syndrome patient‐derived cells. Graph (A) shows hTERT expression in NTC, romidepsin, and vorinostat‐treated cells. Graph (B) shows THOR methylation % in NTC, romidepsin, and vorinostat‐treated cells (±SEM). Statistical significances were determined by t‐test. n = three independent experiments. HDACi, histone deacetylase inhibitors; NTC, nontreated cells.
Fig. 7
Fig. 7
5‐azacytidine treatment in Sézary cells. Graph (A) shows hTERT expression in NTC and 5‐azacytidine‐treated cells (±SEM). Graph (B) shows THOR methylation % in NTC and 5‐azacytidine‐treated cells. Statistical significances were determined by t‐test. n = three independent experiments. ATG, start codon; NTC, nontreated cells; SS PDCs, Sézary syndrome patient‐derived cells; TSS, transcription start site.

References

    1. Willemze R, Cerroni L, Kempf W, Berti E, Facchetti F, Swerdlow SH & Jaffe ES (2019) The 2018 update of the WHO‐EORTC classification for primary cutaneous lymphomas. Blood 133, 1703–1714. - PMC - PubMed
    1. Willemze R, Jaffe ES, Burg G, Cerroni L, Berti E, Swerdlow SH, Ralfkiaer E, Chimenti S, Diaz‐Perez JL, Duncan LM et al. (2005) WHO‐EORTC classification for cutaneous lymphomas. Blood 105, 3768–3785. - PubMed
    1. Willemze R, Hodak E, Zinzani PL, Specht L, Ladetto M & ESMO Guidelines Committee (2018) Primary cutaneous lymphomas: ESMO clinical practice guidelines for diagnosis, treatment and follow‐up. Ann Oncol 29 (Suppl 4), iv30–iv40. - PubMed
    1. Hristov AC, Tejasvi T & Wilcox RA (2019) Mycosis fungoides and Sézary syndrome: 2019 update on diagnosis, risk‐stratification, and management. Am J Hematol 94, 1027–1041. - PubMed
    1. Finkel T, Serrano M & Blasco MA (2007) The common biology of cancer and ageing. Nature 448, 767–774. - PubMed

Publication types