

Research on sablefish (Anoplopoma fimbria) suggests that limited capacity to increase heart function leaves hypoxic fish susceptible to heat waves
- PMID: 33715435
- PMCID: PMC7944113
- DOI: 10.1098/rspb.2020.2340
Research on sablefish (Anoplopoma fimbria) suggests that limited capacity to increase heart function leaves hypoxic fish susceptible to heat waves
Abstract
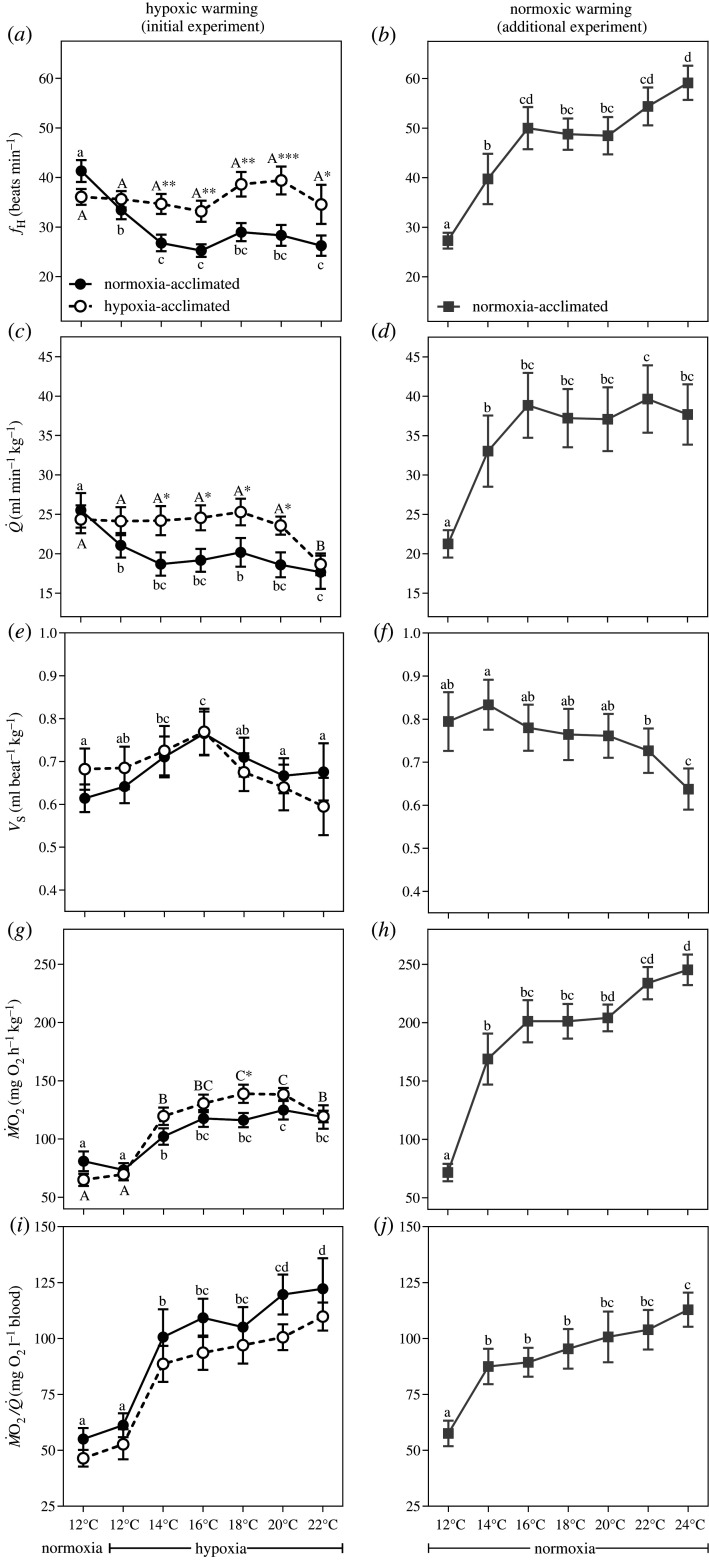
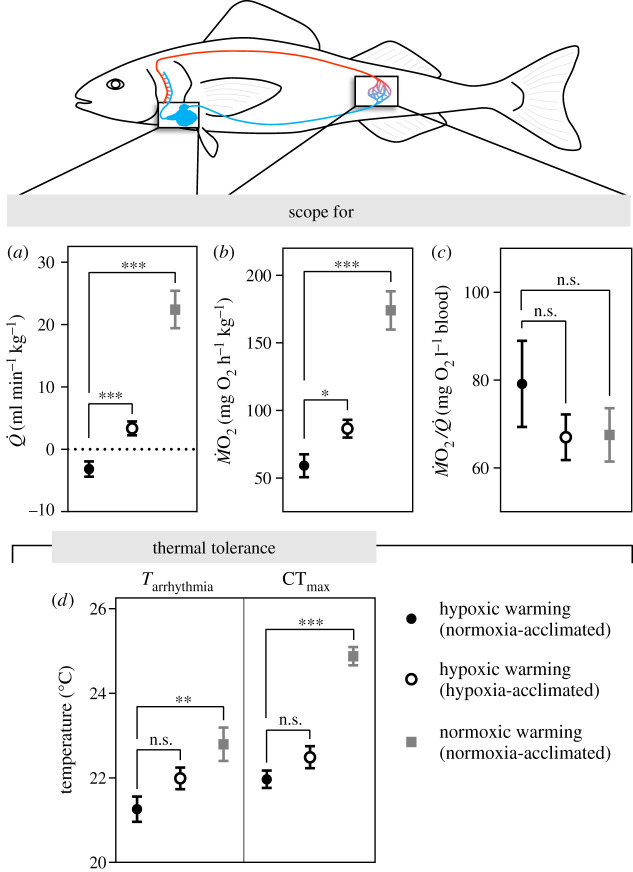
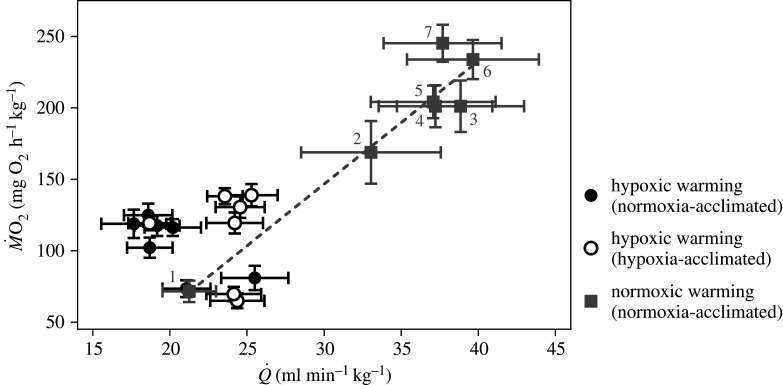
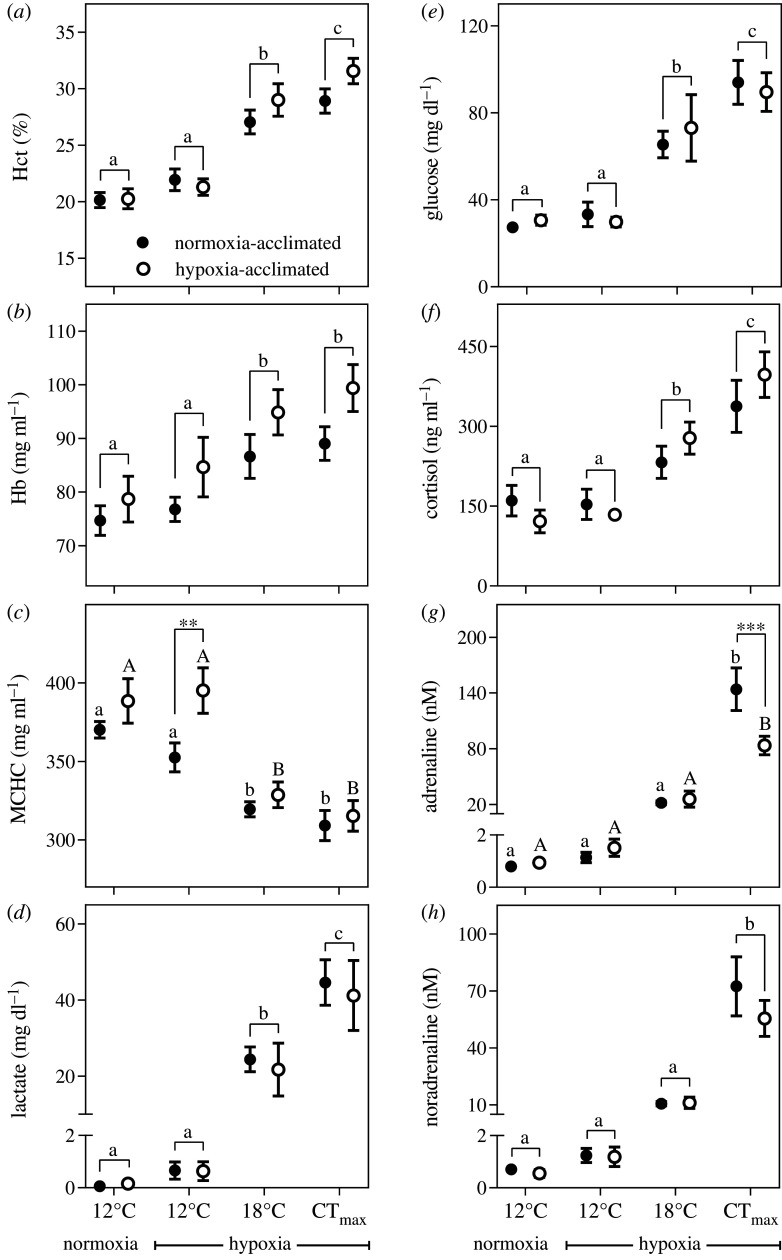
Studies of heart function and metabolism have been used to predict the impact of global warming on fish survival and distribution, and their susceptibility to acute and chronic temperature increases. Yet, despite the fact that hypoxia and high temperatures often co-occur, only one study has examined the effects of hypoxia on fish thermal tolerance, and the consequences of hypoxia for fish cardiac responses to acute warming have not been investigated. We report that sablefish (Anoplopoma fimbria) did not increase heart rate or cardiac output when warmed while hypoxic, and that this response was associated with reductions in maximum O2 consumption and thermal tolerance (CTmax) of 66% and approximately 3°C, respectively. Further, acclimation to hypoxia for four to six months did not substantially alter the sablefish's temperature-dependent physiological responses or improve its CTmax. These results provide novel, and compelling, evidence that hypoxia can impair the cardiac and metabolic response to increased temperatures in fish, and suggest that some coastal species may be more vulnerable to climate change-related heat waves than previously thought. Further, they support research showing that cross-tolerance and physiological plasticity in fish following hypoxia acclimation are limited.
Keywords: cardiac function; climate change; haematology; hypoxia; temperature; thermal tolerance.
Figures
Similar articles
-
The environmental tolerances and metabolic physiology of sablefish (Anoplopoma fimbria).Comp Biochem Physiol A Mol Integr Physiol. 2019 May;231:140-148. doi: 10.1016/j.cbpa.2019.02.004. Epub 2019 Feb 10. Comp Biochem Physiol A Mol Integr Physiol. 2019. PMID: 30743060
-
Physiological plasticity of cardiorespiratory function in a eurythermal marine teleost, the longjaw mudsucker, Gillichthys mirabilis.J Exp Biol. 2013 Jun 1;216(Pt 11):2111-21. doi: 10.1242/jeb.083873. J Exp Biol. 2013. PMID: 23678101
-
Long-term hypoxia exposure alters the cardiorespiratory physiology of steelhead trout (Oncorhynchus mykiss), but does not affect their upper thermal tolerance.J Therm Biol. 2017 Aug;68(Pt B):149-161. doi: 10.1016/j.jtherbio.2016.03.007. Epub 2016 Mar 19. J Therm Biol. 2017. PMID: 28797475
-
Do aquatic ectotherms perform better under hypoxia after warm acclimation?J Exp Biol. 2021 Feb 4;224(Pt 3):jeb232512. doi: 10.1242/jeb.232512. J Exp Biol. 2021. PMID: 33542094 Review.
-
Hypoxic and Thermal Stress: Many Ways Leading to the NOS/NO System in the Fish Heart.Antioxidants (Basel). 2021 Aug 31;10(9):1401. doi: 10.3390/antiox10091401. Antioxidants (Basel). 2021. PMID: 34573033 Free PMC article. Review.
Cited by
-
Hyperoxia does not improve the acute upper thermal tolerance of a tropical marine fish (Lutjanus apodus).J Exp Biol. 2024 Nov 1;227(21):jeb247703. doi: 10.1242/jeb.247703. Epub 2024 Nov 7. J Exp Biol. 2024. PMID: 39369300 Free PMC article.
-
It's a good thing that severely hypoxic salmon (Salmo salar) have a limited capacity to increase heart rate when warmed.J Exp Biol. 2025 Mar 1;228(5):JEB249594. doi: 10.1242/jeb.249594. Epub 2025 Mar 6. J Exp Biol. 2025. PMID: 39882674 Free PMC article.
-
Effects of acute cooling and bradycardia on central venous pressure and cardiac function in Nile tilapia (Oreochromis niloticus).J Comp Physiol B. 2025 Apr;195(2):173-179. doi: 10.1007/s00360-024-01600-1. Epub 2025 Jan 7. J Comp Physiol B. 2025. PMID: 39774969
-
Acute and chronic cold exposure differentially affect cardiac control, but not cardiorespiratory function, in resting Atlantic salmon (Salmo salar).Curr Res Physiol. 2022 Mar 17;5:158-170. doi: 10.1016/j.crphys.2022.03.002. eCollection 2022. Curr Res Physiol. 2022. PMID: 35359619 Free PMC article.
-
Cardiorespiratory physiology and swimming capacity of Atlantic salmon (Salmo salar) at cold temperatures.J Exp Biol. 2023 Sep 1;226(17):jeb245990. doi: 10.1242/jeb.245990. Epub 2023 Sep 6. J Exp Biol. 2023. PMID: 37661722 Free PMC article.
References
-
- IPCC. 2014. Climate change 2014: synthesis report. Geneva, Switzerland: IPCC.
Publication types
MeSH terms
Associated data
LinkOut - more resources
Full Text Sources
Other Literature Sources
