

Human biases limit cumulative innovation
- PMID: 33715436
- PMCID: PMC7944091
- DOI: 10.1098/rspb.2020.2752
Human biases limit cumulative innovation
Abstract
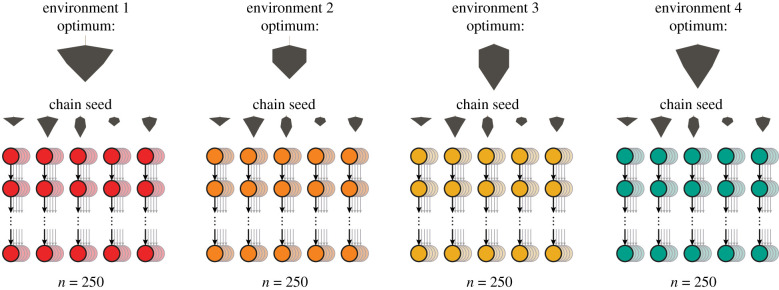
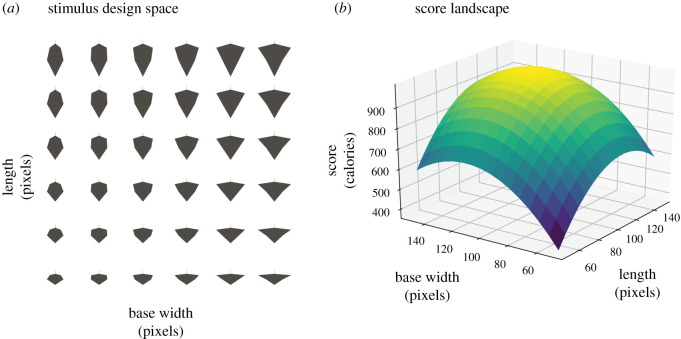
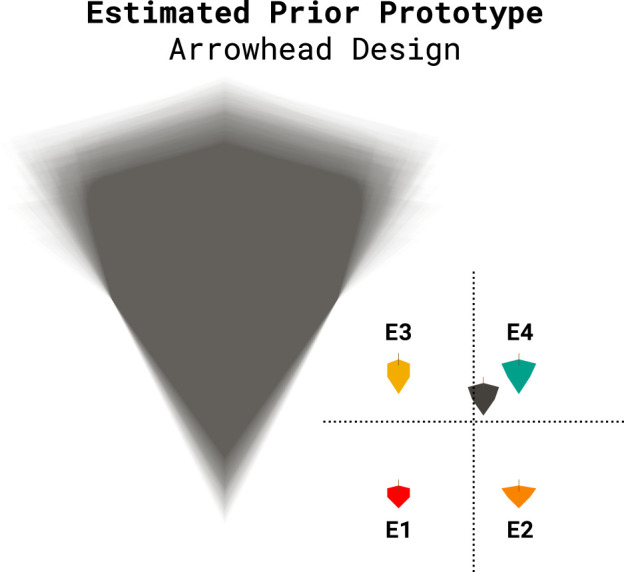
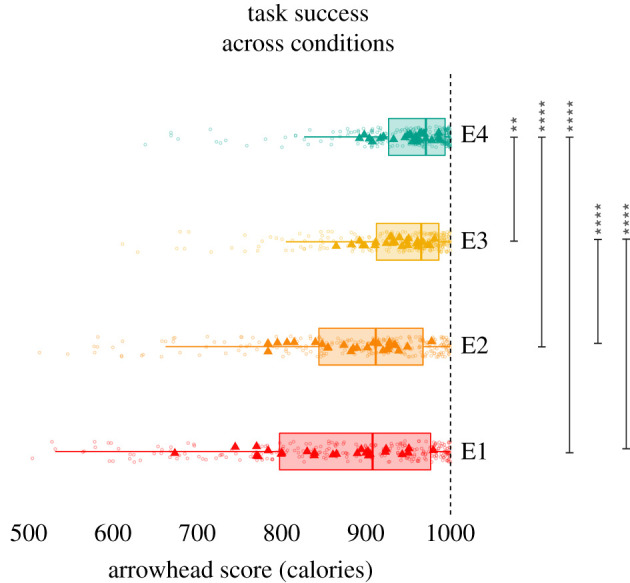
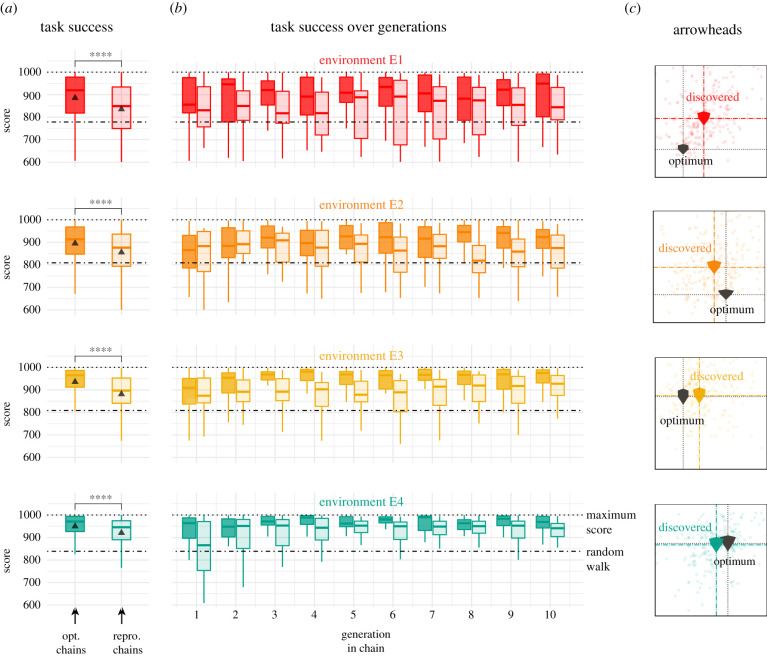
Is technological advancement constrained by biases in human cognition? People in all societies build on discoveries inherited from previous generations, leading to cumulative innovation. However, biases in human learning and memory may influence the process of knowledge transmission, potentially limiting this process. Here, we show that cumulative innovation in a continuous optimization problem is systematically constrained by human biases. In a large (n = 1250) behavioural study using a transmission chain design, participants searched for virtual technologies in one of four environments after inheriting a solution from previous generations. Participants converged on worse solutions in environments misaligned with their biases. These results substantiate a mathematical model of cumulative innovation in Bayesian agents, highlighting formal relationships between cultural evolution and distributed stochastic optimization. Our findings provide experimental evidence that human biases can limit the advancement of knowledge in a controlled laboratory setting, reinforcing concerns about bias in creative, scientific and educational contexts.
Keywords: Bayesian; cultural evolution; function learning; inductive bias; innovation; optimization.
Figures
Similar articles
-
Review. Theoretical and empirical evidence for the impact of inductive biases on cultural evolution.Philos Trans R Soc Lond B Biol Sci. 2008 Nov 12;363(1509):3503-14. doi: 10.1098/rstb.2008.0146. Philos Trans R Soc Lond B Biol Sci. 2008. PMID: 18801717 Free PMC article. Review.
-
Innovation and social transmission in experimental micro-societies: exploring the scope of cumulative culture in young children.Philos Trans R Soc Lond B Biol Sci. 2017 Dec 5;372(1735):20160425. doi: 10.1098/rstb.2016.0425. Philos Trans R Soc Lond B Biol Sci. 2017. PMID: 29061897 Free PMC article.
-
The evolution of cognitive biases in human learning.J Theor Biol. 2022 May 21;541:111031. doi: 10.1016/j.jtbi.2022.111031. Epub 2022 Feb 7. J Theor Biol. 2022. PMID: 35143847
-
Social network architecture and the tempo of cumulative cultural evolution.Proc Biol Sci. 2021 Mar 10;288(1946):20203107. doi: 10.1098/rspb.2020.3107. Epub 2021 Mar 10. Proc Biol Sci. 2021. PMID: 33715438 Free PMC article.
-
Blind alleys and fruitful pathways in the comparative study of cultural cognition.Phys Life Rev. 2022 Dec;43:211-238. doi: 10.1016/j.plrev.2022.10.003. Epub 2022 Oct 21. Phys Life Rev. 2022. PMID: 36343568 Review.
Cited by
-
Superhuman artificial intelligence can improve human decision-making by increasing novelty.Proc Natl Acad Sci U S A. 2023 Mar 21;120(12):e2214840120. doi: 10.1073/pnas.2214840120. Epub 2023 Mar 13. Proc Natl Acad Sci U S A. 2023. PMID: 36913582 Free PMC article.
-
Do large language models have a legal duty to tell the truth?R Soc Open Sci. 2024 Aug 7;11(8):240197. doi: 10.1098/rsos.240197. eCollection 2024 Aug. R Soc Open Sci. 2024. PMID: 39113763 Free PMC article.
-
Negative observational learning might play a limited role in the cultural evolution of technology.Sci Rep. 2022 Jan 19;12(1):970. doi: 10.1038/s41598-022-05031-2. Sci Rep. 2022. PMID: 35046491 Free PMC article.
-
Machine culture.Nat Hum Behav. 2023 Nov;7(11):1855-1868. doi: 10.1038/s41562-023-01742-2. Epub 2023 Nov 20. Nat Hum Behav. 2023. PMID: 37985914 Review.
-
Exploring new technologies for the future generation: exploration-exploitation trade-off in an intergenerational framework.R Soc Open Sci. 2024 May 1;11(5):231108. doi: 10.1098/rsos.231108. eCollection 2024 May. R Soc Open Sci. 2024. PMID: 38699556 Free PMC article.
References
-
- Henrich J 2015. The secret of our success: how culture is driving human evolution, domesticating our species, and making us smarter. Princeton, NJ: Princeton University Press.
-
- Boyd R, Richerson PJ, Henrich J. 2013. The cultural evolution of technology. In Cultural evolution (eds PJ Richerson, MH Christiansen), pp. 119–142. New York, NY: The MIT Press.
Publication types
MeSH terms
LinkOut - more resources
Full Text Sources
Other Literature Sources
