. 2021 Mar 10;288(1946):20203107.
doi: 10.1098/rspb.2020.3107. Epub 2021 Mar 10.

Social network architecture and the tempo of cumulative cultural evolution

Affiliations

Social network architecture and the tempo of cumulative cultural evolution

Mauricio Cantor et al. Proc Biol Sci. .

Abstract

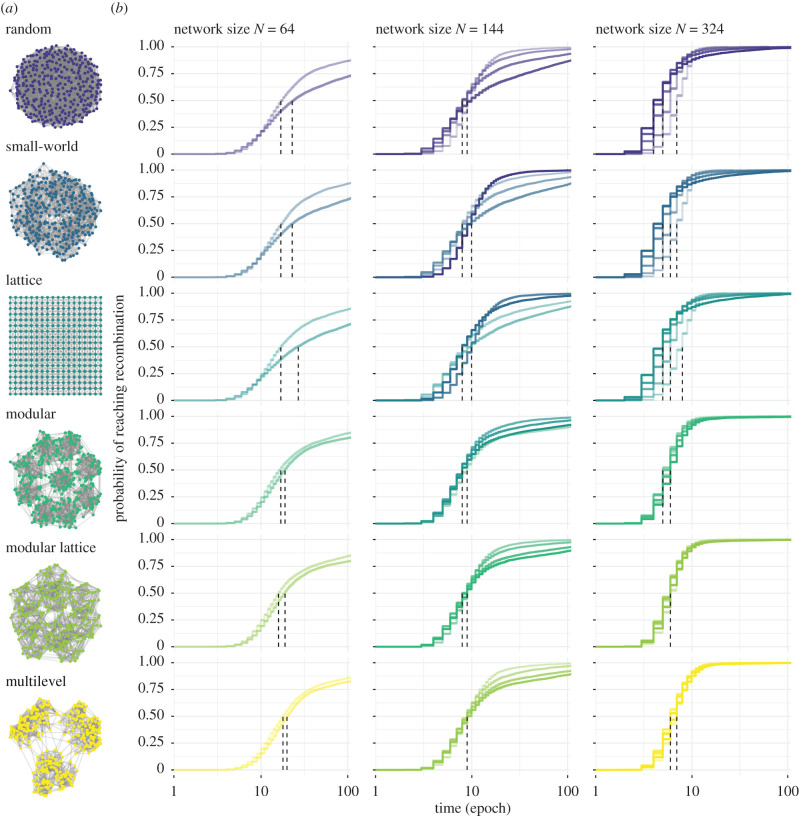
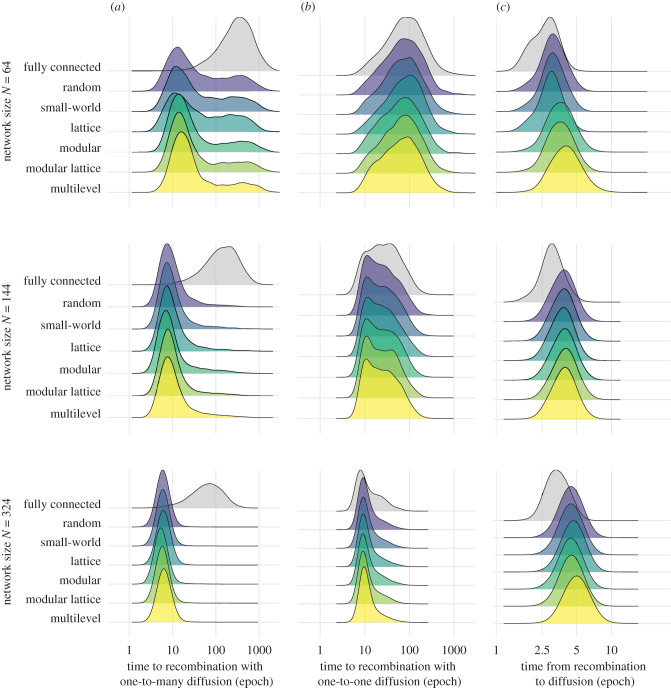
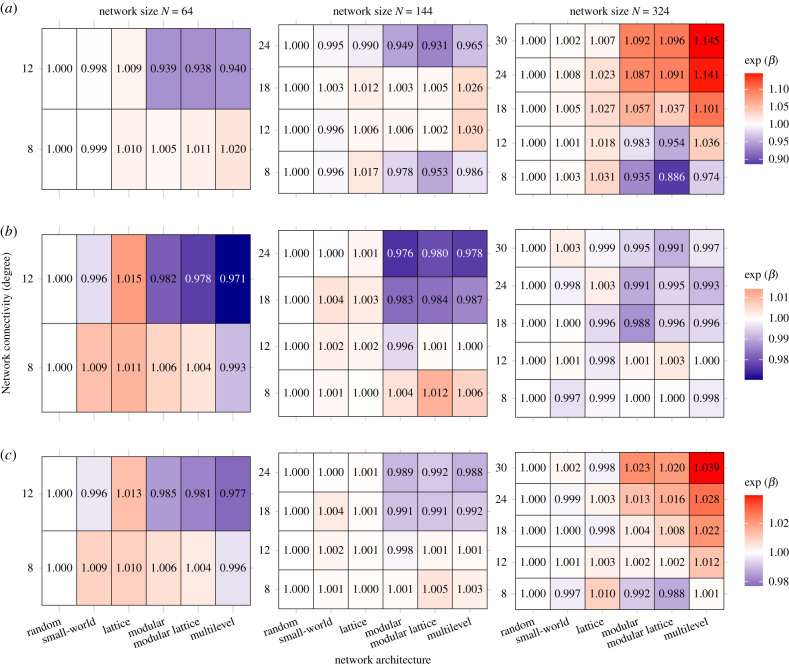
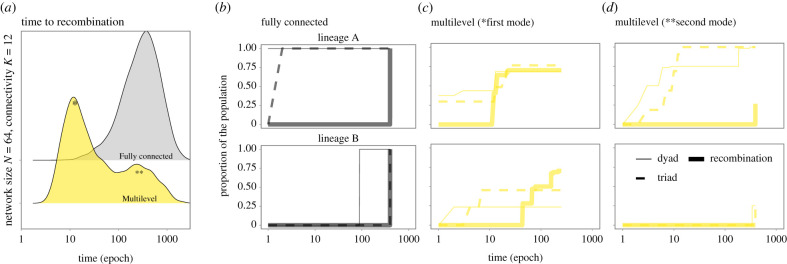
The ability to build upon previous knowledge-cumulative cultural evolution-is a hallmark of human societies. While cumulative cultural evolution depends on the interaction between social systems, cognition and the environment, there is increasing evidence that cumulative cultural evolution is facilitated by larger and more structured societies. However, such effects may be interlinked with patterns of social wiring, thus the relative importance of social network architecture as an additional factor shaping cumulative cultural evolution remains unclear. By simulating innovation and diffusion of cultural traits in populations with stereotyped social structures, we disentangle the relative contributions of network architecture from those of population size and connectivity. We demonstrate that while more structured networks, such as those found in multilevel societies, can promote the recombination of cultural traits into high-value products, they also hinder spread and make products more likely to go extinct. We find that transmission mechanisms are therefore critical in determining the outcomes of cumulative cultural evolution. Our results highlight the complex interaction between population size, structure and transmission mechanisms, with important implications for future research.

Keywords: cultural complexity; cultural evolution; multilevel societies; small-world networks; social structure.


Figures

Figure 1.
Figure 1.
Social network architectures, and the time to recombination for each architecture across population sizes and levels of connectivity using model 1. (a) Network architectures vary in clustering and modularity: Random (unclustered C = 0.03, non-modular Q = 0.24), small-world (clustered C = 0.52, medium-modular Q = 0.63), lattice (clustered C = 0.45, medium-modular Q = 0.54), modular (unclustered C = 0.23, modular Q = 0.82), modular lattices (clustered C = 0.41, modular Q = 0.81), multilevel (clustered C = 0.42, modular Q = 0.83). Each binary network depicts populations with the same number of individuals (here, N = 324 nodes) that have the same number of social connections (here, degree K = 12 links per node; density D = 0.037) but are wired differently. (b) Cumulative incidence of recombination events (y-axis) as a stepwise function over time (x-axis, log epochs) for small (N = 64), medium (N = 144) and large population sizes (N = 324). The line shading represents the amount of network connectivity (node degree K, where the lighter the shade, the smaller the degree (K ∈ {8,12} for N = 64; K ∈ {8,12,18,24} for N = 144; K ∈ {8,12,18,24,30} for N = 324). Vertical dashed lines indicate the median of time to recombination (S(t) ≤ 0.5) per network connectivity, across architectures. The time to reach recombination was truncated to 100 epochs for better visualization. Curves were calculated based on 5000 simulations. (Online version in colour.)
Figure 2.
Figure 2.
Time to recombination and time from recombination to diffusion across network architectures with varying sizes but a fixed degree. Comparison of the performance across the range of network architectures of the same degree (here K = 12 links per node) and fully connected networks of the same size (N = 64, N = 144 and N = 324 nodes, K = 63, 143 and 323, respectively). (a) Time to recombination (log epochs) from 5000 simulations with model 1 that uses a broadcast (one-to-many) diffusion dynamic. (b) Time to recombination (log epochs) from 5000 simulations with model 2 that uses a dyadic (one-to-one) diffusion dynamic. (c) Difference between the time to recombination and the time to diffusion, where time to diffusion corresponds to the latency until the majority of the individuals in the population has information about the final higher-payoff product, from 5000 simulations using model 2 (one-to-one diffusion). All ridges were plotted with the same bandwidth (0.18). (Online version in colour.)
Figure 3.
Figure 3.
Relative performance of network architectures within each of the 11 combinations of population size and level of connectivity used in the simulations. Each row of each table reports the coefficient estimate of GLMs of network architecture (column) in function of the time to recombination while maintaining degree (row) and network size (box) constant. Higher coefficients (red colours) represent a poorer performance (longer latency to recombination) while lower coefficients (blue colours) represent architecture that perform better (shorter latency to recombination) for that combination of population size and level of connectivity (using random networks as the reference architecture in the GLM intercept). The relative performance of each architecture is shown for (a) time to recombination under a one-to-many diffusion mechanism (model 1), (b) time to recombination under a one-to-one diffusion mechanism (model 2) and (c) total time to diffusion (from simulation start until the majority of the population has information about the final higher-payoff product) under a one-to-one diffusion mechanism (model 2). (Online version in colour.)
Figure 4.
Figure 4.
Cultural product diversity across time in a fully connected social network and in a highly structured network architecture. The distributions of time to recombination and cultural product diversity illustrates how early stochasticity can affect cultural diversity, even within the same network architecture, and therefore, can shape the outcomes of cumulative cultural evolution. (a) Time to recombination (epochs) from 5000 simulations with one-to-many diffusion dynamics (model 1) in multilevel and fully connected networks (with N = 64 and K = 12) highlights distinct cultural trajectories among the highly structured networks (note the bimodal distribution). Following panels show cultural diversity over time from one simulation taken from the (b) single mode of the fully connected network, and the (c) first (*) and (d) second (**) modes of the distribution of results from the multilevel architecture. Cultural diversity (y-axis) represents the proportion of the population with one of the possible products over time: a combination of two inventory items (2nd stage; thin full lines), a valid combination triad of items (3rd stage; dashed lines) and the final higher-payoff product, i.e. a triad recombining products from the two lineages (recombination; thick full lines). These products could come from two independent cultural lineages: lineage A (top row) and lineage B. For better visualization, the distribution of single inventory items (1st stage product) was omitted (but see electronic supplementary material, figure S1). (Online version in colour.)

Similar articles

Cited by

References

    1. Tomasello M. 1999. The human adaptation for culture. Annu. Rev. Anthrop. 28, 509-529. (10.1146/annurev.anthro.28.1.509) - DOI
    1. Mesoudi A, Thornton A. 2018. What is cumulative cultural evolution? Proc. R. Soc. B 285, 20180712. (10.1098/rspb.2018.0712) - DOI - PMC - PubMed
    1. Derex M, Mesoudi A. 2020. Cumulative cultural evolution within evolving population structures. Trends Cogn. Sci. 24, 654-667. (10.1016/j.tics.2020.04.005) - DOI - PubMed
    1. Boyd R, Richerson PJ. 2005. The origin and evolution of cultures. Oxford, UK: Oxford University Press.
    1. Boyd R, Richerson PJ, Henrich J. 2011. The cultural niche: why social learning is essential for human adaptation. Proc. Natl Acad. Sci. USA 108, 10 918-10 925. (10.1073/pnas.1100290108) - DOI - PMC - PubMed

Publication types

LinkOut - more resources