. 2021;106(2):1197-1211.
doi: 10.1007/s11071-021-06324-3. Epub 2021 Mar 8.

Dynamics of COVID-19 transmission with comorbidity: a data driven modelling based approach

Affiliations

Dynamics of COVID-19 transmission with comorbidity: a data driven modelling based approach

Parthasakha Das et al. Nonlinear Dyn. 2021.

Abstract

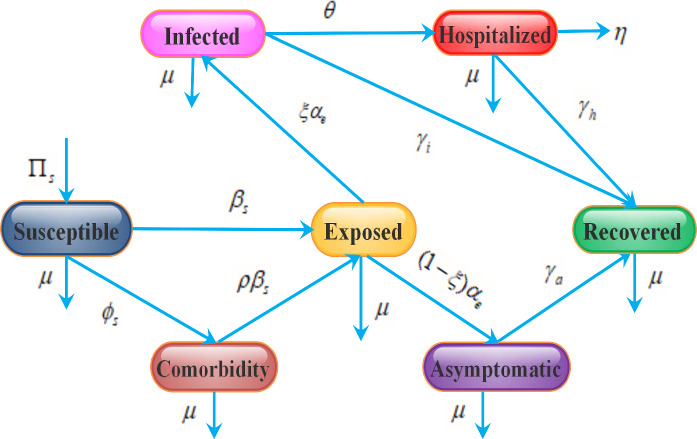
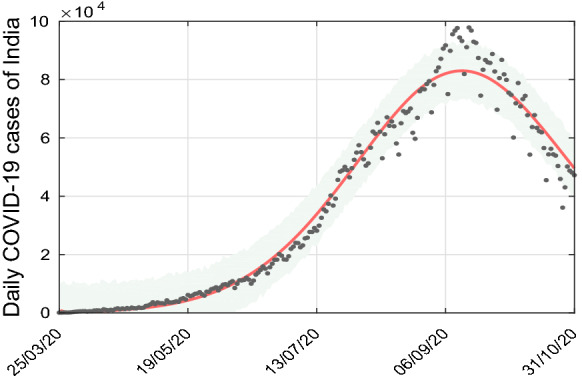
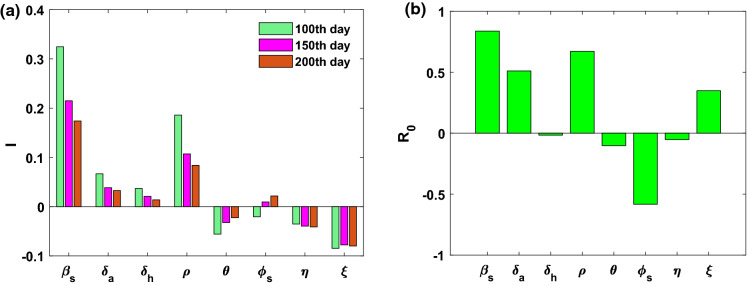
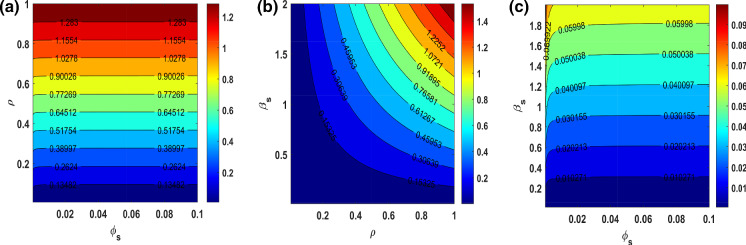
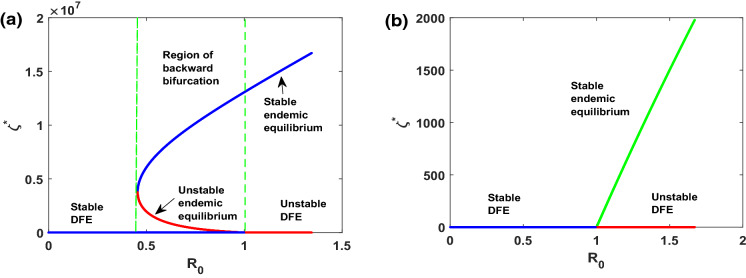
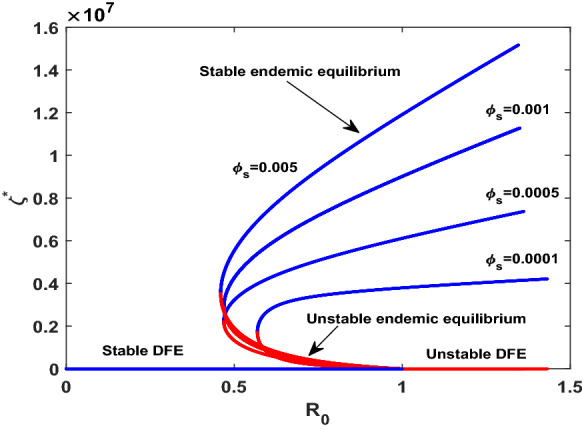
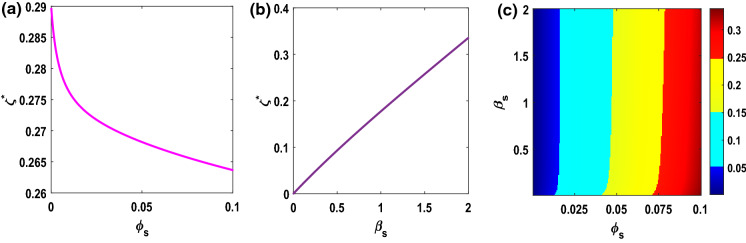
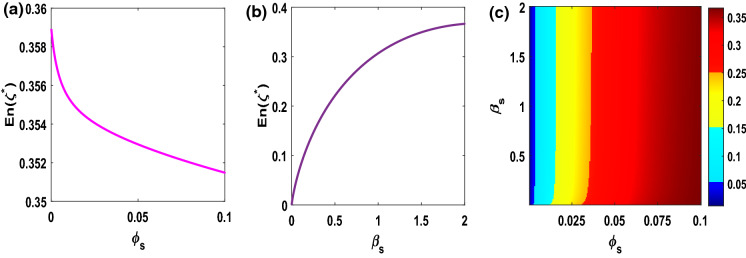
An outbreak of the COVID-19 pandemic is a major public health disease as well as a challenging task to people with comorbidity worldwide. According to a report, comorbidity enhances the risk factors with complications of COVID-19. Here, we propose and explore a mathematical framework to study the transmission dynamics of COVID-19 with comorbidity. Within this framework, the model is calibrated by using new daily confirmed COVID-19 cases in India. The qualitative properties of the model and the stability of feasible equilibrium are studied. The model experiences the scenario of backward bifurcation by parameter regime accounting for progress in susceptibility to acquire infection by comorbidity individuals. The endemic equilibrium is asymptotically stable if recruitment of comorbidity becomes higher without acquiring the infection. Moreover, a larger backward bifurcation regime indicates the possibility of more infection in susceptible individuals. A dynamics in the mean fluctuation of the force of infection is investigated with different parameter regimes. A significant correlation is established between the force of infection and corresponding Shannon entropy under the same parameters, which provides evidence that infection reaches a significant proportion of the susceptible.

Keywords: Backward bifurcation; COVID-19; Comorbidity; Model calibration; Sensitivity analysis; Shannon entropy.


Conflict of interest statement

Conflict of interestThe authors have no conflict of interest concerning the publication of this manuscript.

Figures

Fig. 1
Fig. 1
Schematic illustration of SCEAIHR model. The flow diagram exhibits the interaction of different stages of individuals in the model: susceptible (S), comorbidity (C), exposed (E), asymptomatic (A), infected (I), hospitalized (H) and recovered (R)
Fig. 2
Fig. 2
The SCEAIHR model fitted to daily new confirmed COVID-19 cases in India. Observed data points are shown in black dots and the solid red line depicts the model simulated curve
Fig. 3
Fig. 3
a and b PRCC indicating sensitivity indices to infected individual (I) and basic reproduction number (R0). PRCC values of various parameters with the level of significance 0.05. Sample size = 500 for each parameters is taken based on LHS approach with uniform probability distribution
Fig. 4
Fig. 4
Contour plots indicating the nature of change in basic reproduction number(R0) of SCEAIHR model under parametric planes. a R0 versus (ρ,ϕs)(0,1]×(0,0.1]. b R0 versus (ρ,βs)(0,1]×(0,2]. (c) R0 versus (ϕs,βs)(0,0.1]×(0,2]
Fig. 5
Fig. 5
a R0 versus ζ plot indicating backward bifurcation of SCEAIHR model in ρ[0.01,0.8]. b R0 versus ζ plot illustrating transcritical bifurcation of SCEAIHR model in ϕs[10×10-6,2.7×10-5] with ρ=0. All the remaining parameters values are reported in Table 1
Fig. 6
Fig. 6
Impacts of variation in ϕs, on backward bifurcation with ρ[0.01,0.8], keeping all parameters value remained same as in Table 1. The diagram exhibits that the extent of backward bifurcation regime increases gradually with the increasing of ϕs
Fig. 7
Fig. 7
a, b represent ϕs versus ζ plot (with ρ(0,0.1]) and βs versus ζ plot (with βs(0,2]). c represent ζ over (ϕs,βs) matrix plot, where (ϕs,βs)(0.1]×(0,2]. The corresponding color bar indicates values of ζ. The values of the other parameters are taken as same, shown in Table 1
Fig. 8
Fig. 8
a, b represent ϕs versus En(ζ) plot (with ϕs(0,0.1]) and βs versus En(ζ) plot (with βs(0,2]). (c) represent En(ζ) over (ϕs,βs) matrix plot, where (ϕs,βs)(0,0.1]×(0,2]. The corresponding color bar indicates values of En(ζ). The values of the other parameters are taken as same, shown in Table 1

References

    1. Wang C, Horby PW, Hayden FG, Gao GF. A novel coronavirus outbreak of global health concern. The Lancet. 2020;395(10223):470–473. doi: 10.1016/S0140-6736(20)30185-9. - DOI - PMC - PubMed
    1. Sun G-Q, Wang S-F, Li M-T, Li L, Zhang J, Zhang W, Jin Z, Feng G-L. Transmission dynamics of covid-19 in wuhan, china: effects of lockdown and medical resources. Nonlinear Dyn. 2020;101(3):1981–1993. doi: 10.1007/s11071-020-05770-9. - DOI - PMC - PubMed
    1. Tian H, Liu Y, Li Y, Chieh-Hsi W. An investigation of transmission control measures during the first 50 days of the covid-19 epidemic in china. Science. 2020;368(6491):638–642. doi: 10.1126/science.abb6105. - DOI - PMC - PubMed
    1. Spelta A, Flori A, Pierri F, Bonaccorsi G, Pammolli F. After the lockdown: simulating mobility, public health and economic recovery scenarios. Sci. Rep. 2020;10(1):16950. doi: 10.1038/s41598-020-73949-6. - DOI - PMC - PubMed
    1. Saha, Jay, Chouhan, Pradip: Lockdown and unlock for covid-19 and its impact on residential mobility in india: an analysis of the covid-19 community mobility reports, 2020. Int. J. Infect. Dis. (2020) - PubMed

LinkOut - more resources