

Investigation of the 2018 thick-billed murre (Uria lomvia) die-off on St. Lawrence Island rules out food shortage as the cause
- PMID: 33716412
- PMCID: PMC7949294
- DOI: 10.1016/j.dsr2.2020.104879
Investigation of the 2018 thick-billed murre (Uria lomvia) die-off on St. Lawrence Island rules out food shortage as the cause
Abstract
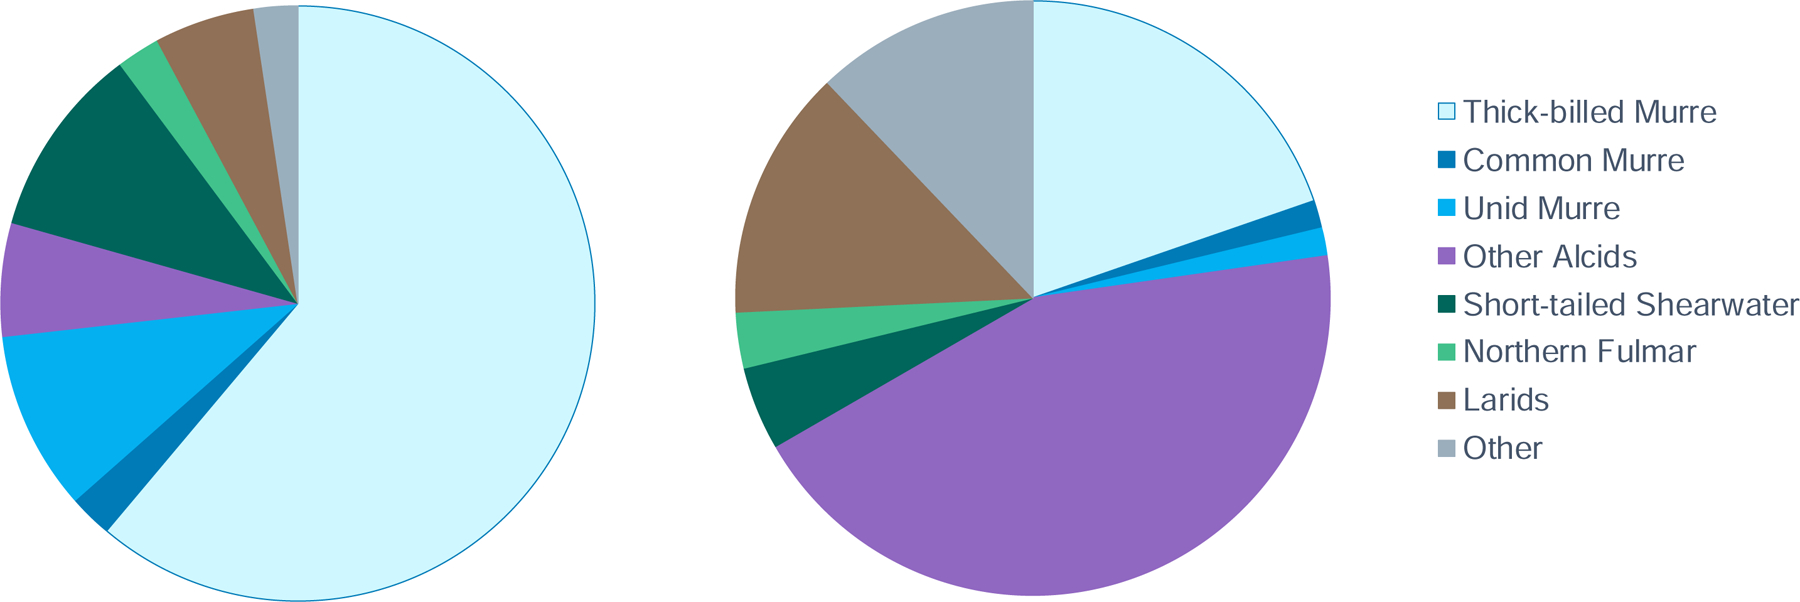
Die-offs of seabirds in Alaska have occurred with increased frequency since 2015. In 2018, on St. Lawrence Island, seabirds were reported washing up dead on beaches starting in late May, peaking in June, and continuing until early August. The cause of death was documented to be starvation, leading to the conclusion that a severe food shortage was to blame. We use physiology and colony-based observations to examine whether food shortage is a sufficient explanation for the die-off, or if evidence indicates an alternative cause of starvation such as disease. Specifically, we address what species were most affected, the timing of possible food shortages, and food shortage severity in a historical context. We found that thick-billed murres (Uria lomvia) were most affected by the die-off, making up 61% of all bird carcasses encountered during beach surveys. Thick-billed murre carcasses were proportionately more numerous (26:1) than would be expected based on ratios of thick-billed murres to co-occurring common murres (U. aalge) observed on breeding study plots (7:1). Concentrations of the stress hormone corticosterone, a reliable physiological indicator of nutritional stress, in thick-billed murre feathers grown in the fall indicate that foraging conditions in the northern Bering Sea were poor in the fall of 2017 and comparable in severity to those experienced by murres during the 1976-1977 Bering Sea regime shift. Concentrations of corticosterone in feathers grown during the pre-breeding molt indicate that foraging conditions in late winter 2018 were similar to previous years. The 2018 murre egg harvest in the village of Savoonga (on St. Lawrence Is.) was one-fifth the 1993-2012 average, and residents observed that fewer birds laid eggs in 2018. Exposure of thick-billed murres to nutritional stress in August, however, was no different in 2018 compared to 2016, 2017, and 2019, and was comparable to levels observed on St. George Island in 2003-2017. Prey abundance, measured by the National Oceanic and Atmospheric Administration in bottom-trawl surveys, was also similar in 2018 to 2017 and 2019, supporting the evidence that food was not scarce in the summer of 2018 in the vicinity of St. Lawrence Island. Of two moribund thick-billed murres collected at the end of the mortality event, one tested positive for a novel re-assortment H10 strain of avian influenza with Eurasian components, likely contracted during the non-breeding season. It is not currently known how widely spread infection of murres with the novel virus was, thus insufficient evidence exists to attribute the die-off to an outbreak of avian influenza. We conclude that food shortage alone is not an adequate explanation for the mortality of thick-billed murres in 2018, and highlight the importance of rapid response to mortality events in order to document alternative or confounding causes of mortality.
Keywords: Arctic; Avian influenza; Feather corticosterone; Food shortage; Marine environment; Mortality; Nutritional stress; Seabirds; Subsistence harvest; Winter.
Conflict of interest statement
Declaration of interests The authors declare that they have no known competing financial interests or personal relationships that could have appeared to influence the work reported in this paper.
Figures


References
-
- Aydin K, Mueter F, 2007. The Bering Sea-A dynamic food web perspective. Deep. Res. Part II Top. Stud. Oceanogr 54, 2501–2525. 10.1016/j.dsr2.2007.08.022 - DOI
-
- Baduini CL, Hyrenbach KD, Coyle KO, Pinchuk A, Mendenhall V, Hunt GL, 2001. Mass mortality of short-tailed shearwaters in the south-eastern Bering Sea during summer 1997. Fish. Oceanogr 10, 117–130. 10.1046/j.1365-2419.2001.00156.x - DOI
-
- Baily EP, Davenport GH, 2016. Die-off of common murres on the Alaska Peninsula and Unimak Island. Condor 74, 215–219.
-
- Basyuk EO, Zuenko YI, 2019. Bering Sea: 2018 As the Extreme Low-Ice and Warm Year. Izv. TINRO 198, 119–142. 10.26428/1606-9919-2019-198-119-142 - DOI
Grants and funding
LinkOut - more resources
Full Text Sources
Research Materials