

Exposure to High-Fat Style Diet Induced Renal and Liver Structural Changes, Lipid Accumulation and Inflammation in Intact and Ovariectomized Female Rats
- PMID: 33716510
- PMCID: PMC7944944
- DOI: 10.2147/JIR.S299083
Exposure to High-Fat Style Diet Induced Renal and Liver Structural Changes, Lipid Accumulation and Inflammation in Intact and Ovariectomized Female Rats
Abstract
Purpose: We hypothesized that low estrogen levels aggravate obesity-related complications. Diet-induced obesity can cause distinct pathologies, including impaired glucose tolerance, inflammation, and organ injury that leads to fatty liver and chronic kidney diseases. To test this hypothesis, ovariectomized (OVX) rats were fed a high-fat style diet (HFSD), and we examined structural changes and inflammatory response in the kidney and liver.
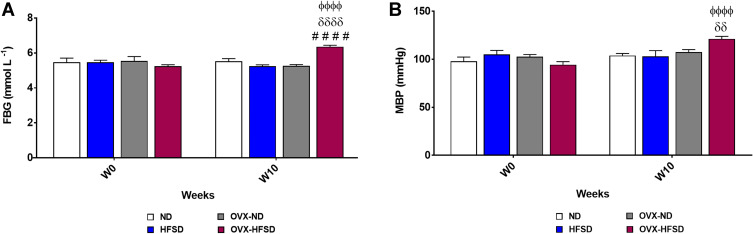
Methods: Sprague-Dawley female rats were ovariectomized or sham-operated and divided into four groups: sham-operated rats fed a normal diet (ND); ovariectomized rats fed a normal diet (OVX-ND); sham-operated rats fed a HFSD; ovariectomized rats fed a high-fat style diet (OVX-HFSD). Mean blood pressure and fasting blood glucose were measured on weeks 0 and 10. The rats were sacrificed 10 weeks after initiation of ND or HFSD, the kidney and liver were harvested for histological, immunohistochemical and immunofluorescence studies.
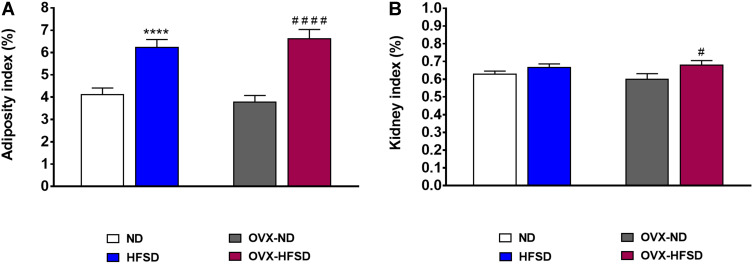
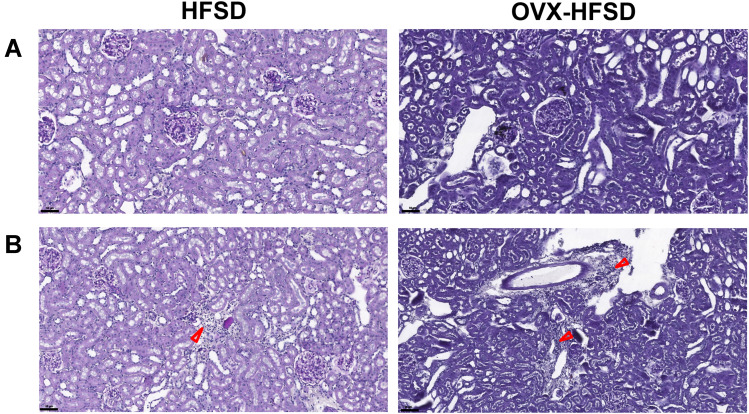
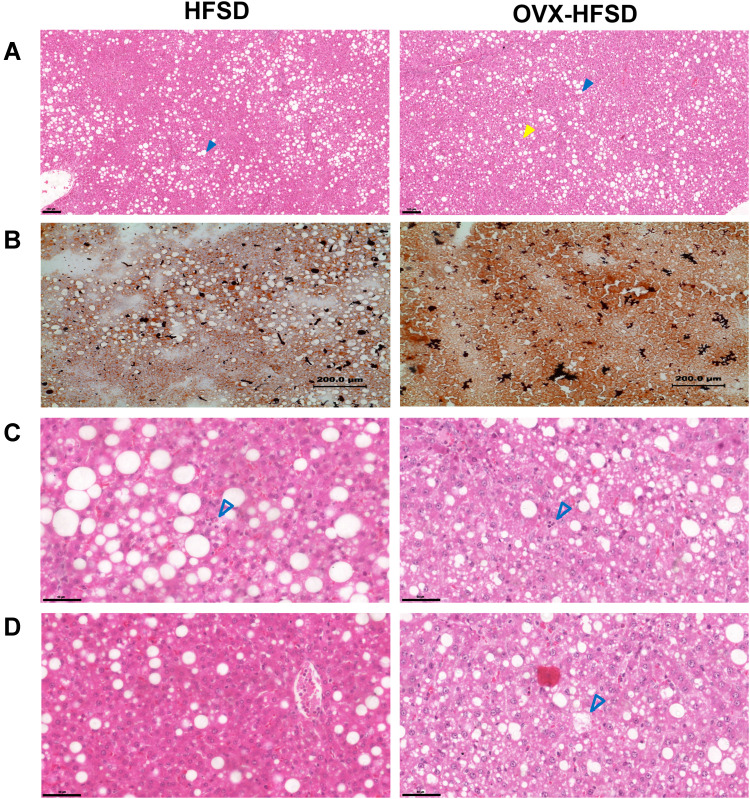
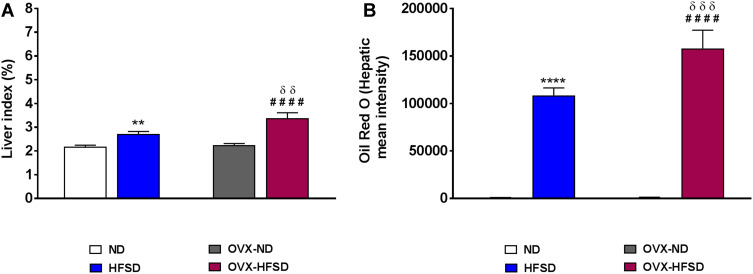
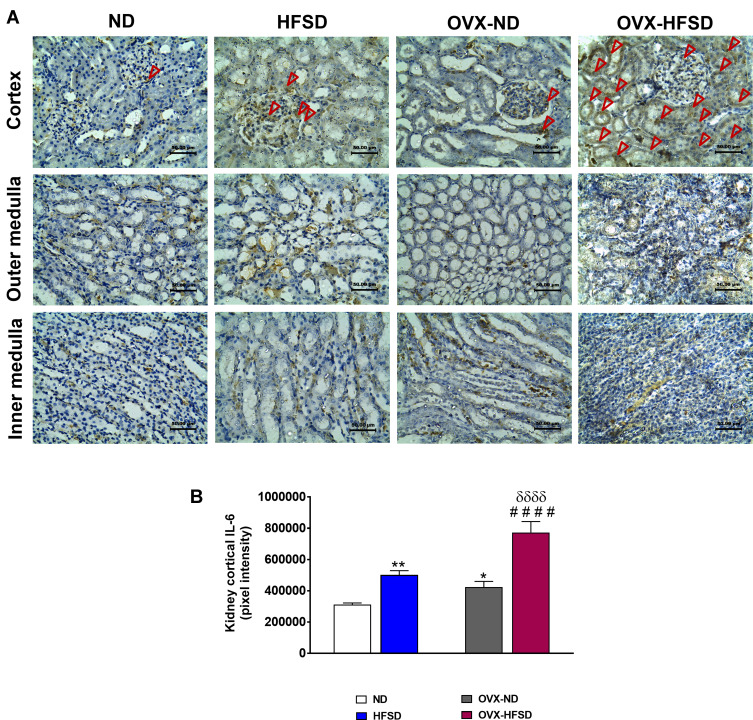
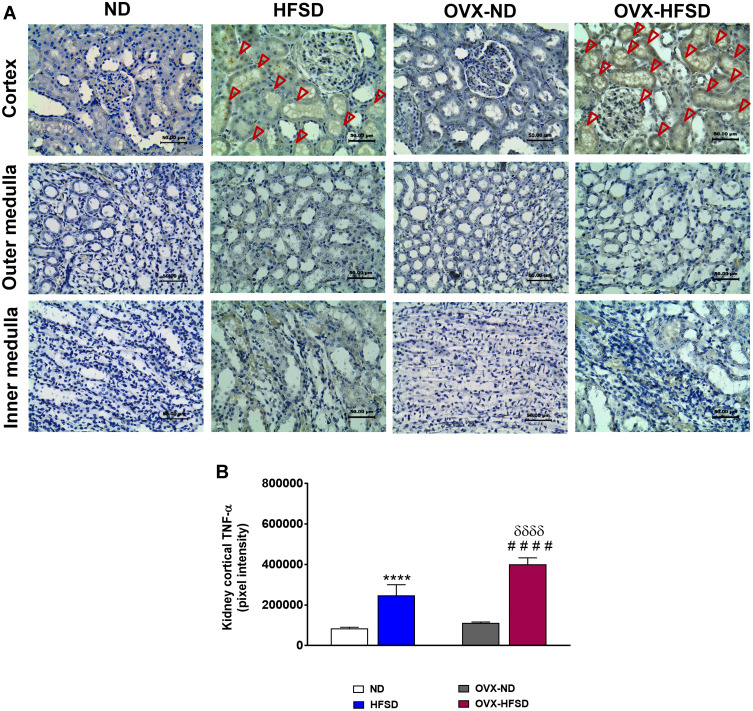
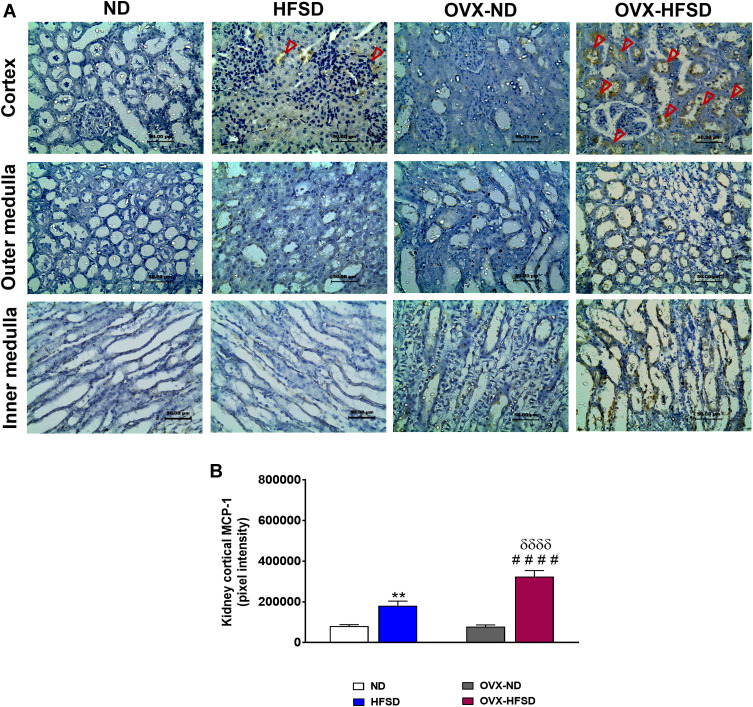
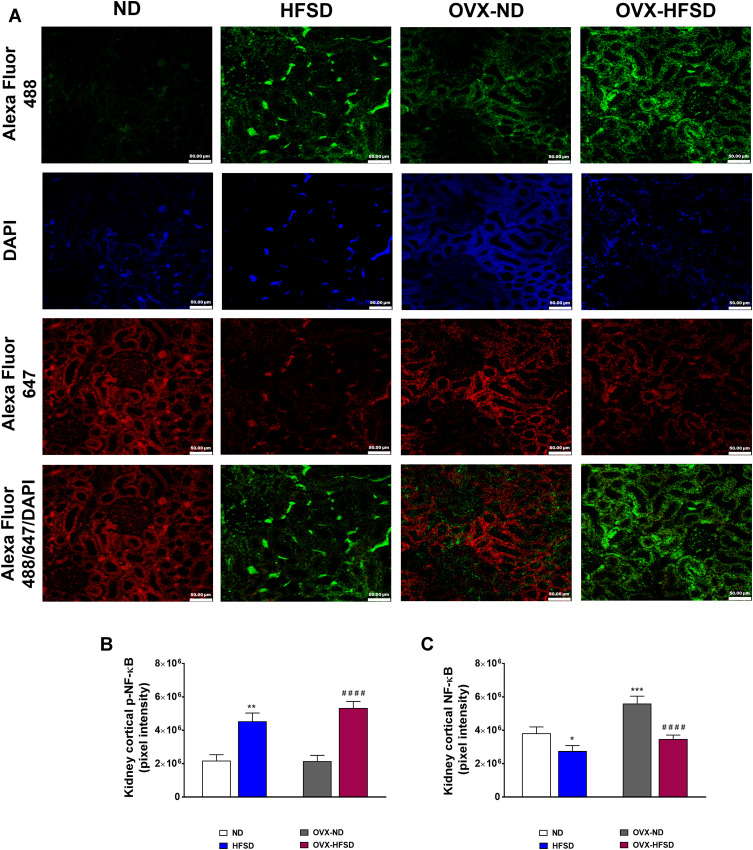
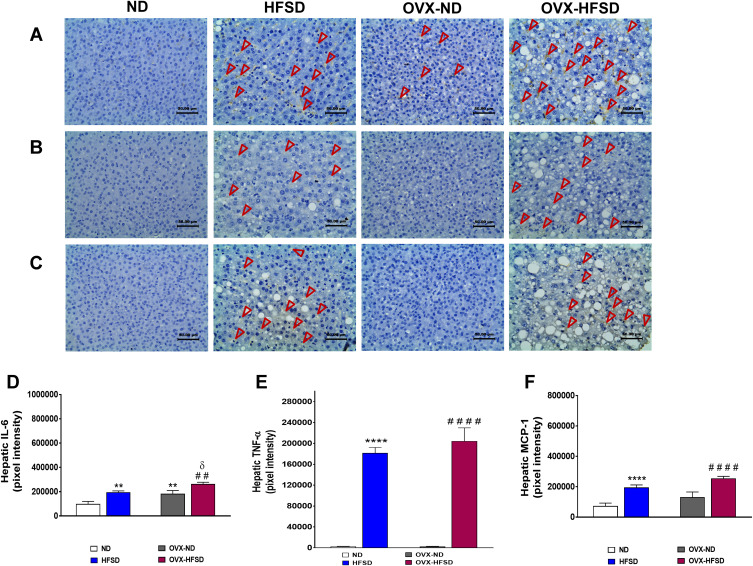
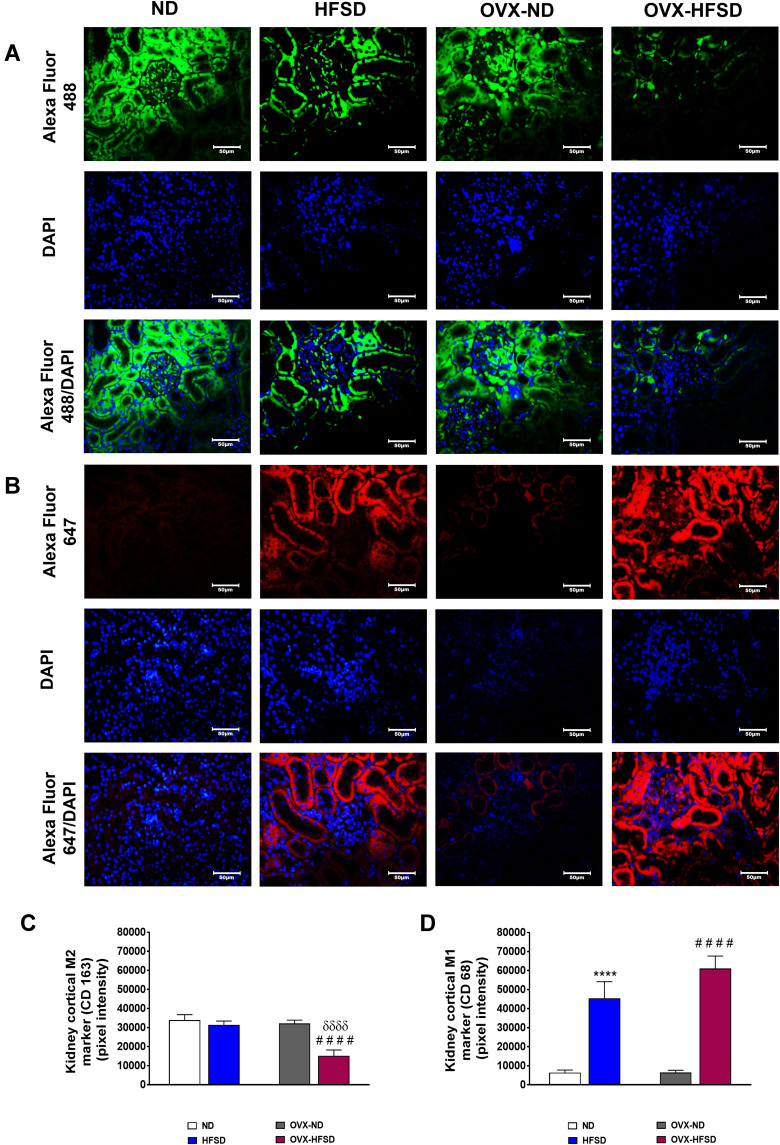
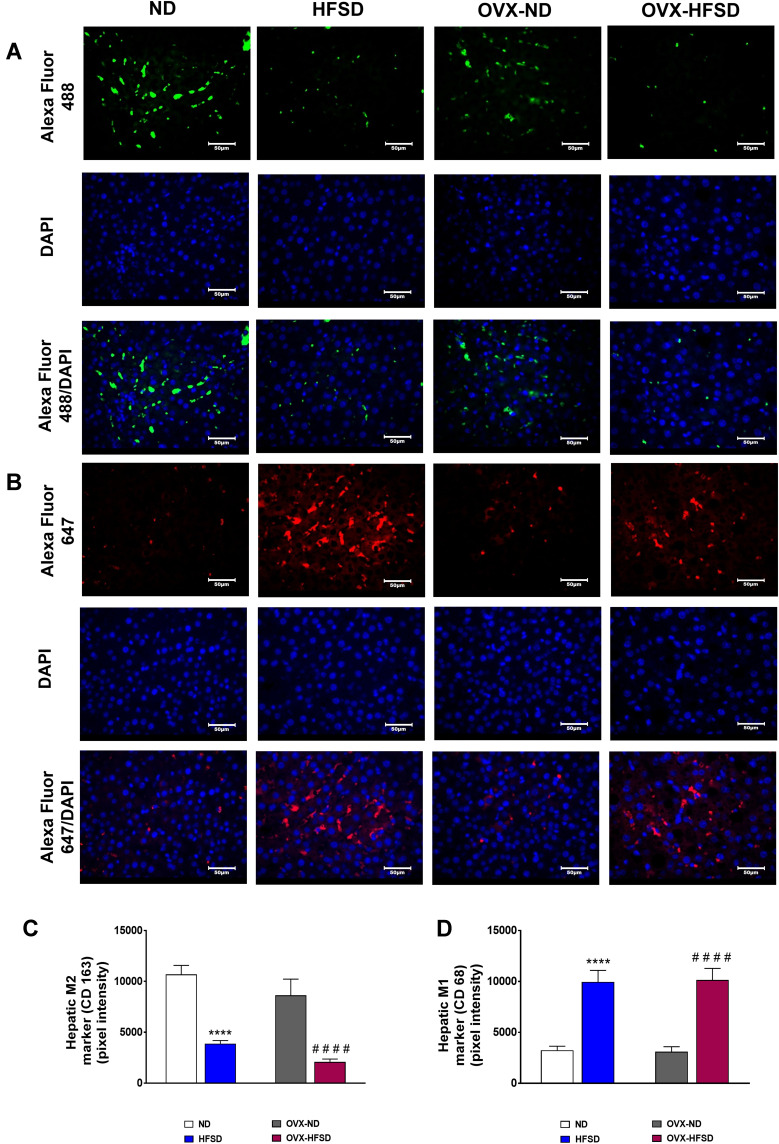
Results: HFSD-fed rats presented a significantly greater adiposity index compared to their ND counterparts. Liver index, fasting blood glucose and mean blood pressure was increased in OVX-HFSD rats compared to HFSD rats at study terminal. Histological and morphometric studies showed focal interstitial mononuclear cell infiltration in the kidney of HFSD rats with mesangial expansion being greater in the OVX-HFSD rats. Both HFSD fed groups showed increased expressions of renal inflammatory markers, namely TNF-alpha, IL-6 and MCP-1, and infiltrating M1 macrophages with some influence of ovarian hormonal status. HFSD-feeding also caused hepatocellular steatosis which was aggravated in ovariectomized rats fed the same diet. Furthermore, hepatocellular ballooning was observed only in the OVX-HFSD rats. Similarly, HFSD-fed rats showed increased expressions of the inflammatory markers and M1 macrophage infiltration in the liver; however, only IL-6 expression was magnified in the OVX-HFSD.
Conclusion: Our data suggest that some of the structural changes and inflammatory response in the kidney and liver of rats fed a HFSD are exacerbated by ovariectomy.
Keywords: hepatic steatosis; macrophage infiltration; mesangial expansion; obesity; ovariectomy.
© 2021 Sucedaram et al.
Conflict of interest statement
The authors declare that this study was conducted in the absence of any commercial or financial relationships that could be construed as a potential conflict of interest.
Figures
Similar articles
-
Renal changes in the early stages of diet-induced obesity in ovariectomized rats.Physiol Res. 2014;63(6):723-32. doi: 10.33549/physiolres.932619. Epub 2014 Aug 26. Physiol Res. 2014. PMID: 25157653
-
Agrimonia pilosa Ledeb. Ameliorates Hyperglycemia and Hepatic Steatosis in Ovariectomized Rats Fed a High-Fat Diet.Nutrients. 2020 Jun 1;12(6):1631. doi: 10.3390/nu12061631. Nutrients. 2020. PMID: 32492866 Free PMC article.
-
Time course of liver lipid infiltration in ovariectomized rats: impact of a high-fat diet.Maturitas. 2007 Oct 20;58(2):182-90. doi: 10.1016/j.maturitas.2007.08.002. Epub 2007 Sep 21. Maturitas. 2007. PMID: 17889461
-
Prophylactic effect of Trigonella foenum-graecum L. seed extract on inflammatory markers and histopathological changes in high-fat-fed ovariectomized rats.J Tradit Complement Med. 2021 Jul 18;12(2):131-140. doi: 10.1016/j.jtcme.2021.07.003. eCollection 2022 Mar. J Tradit Complement Med. 2021. PMID: 35528469 Free PMC article.
-
Carnosic Acid Modulates Increased Hepatic Lipogenesis and Adipocytes Differentiation in Ovariectomized Mice Fed Normal or High-Fat Diets.Nutrients. 2018 Dec 15;10(12):1984. doi: 10.3390/nu10121984. Nutrients. 2018. PMID: 30558262 Free PMC article.
Cited by
-
Sex differences and related estrogenic effects in heart failure with preserved ejection fraction.Heart Fail Rev. 2023 Jul;28(4):937-948. doi: 10.1007/s10741-022-10274-2. Epub 2022 Oct 3. Heart Fail Rev. 2023. PMID: 36190606 Review.
-
Genistein mitigates diet-induced obesity and metabolic dysfunctions in gonadectomized mice with some sex-differential effects.Front Endocrinol (Lausanne). 2024 Sep 16;15:1392866. doi: 10.3389/fendo.2024.1392866. eCollection 2024. Front Endocrinol (Lausanne). 2024. PMID: 39351533 Free PMC article.
-
Estrogen: the forgotten player in metaflammation.Front Pharmacol. 2024 Nov 7;15:1478819. doi: 10.3389/fphar.2024.1478819. eCollection 2024. Front Pharmacol. 2024. PMID: 39575382 Free PMC article. Review.
-
Effects of Obesogenic Diet Consumption During Pregnancy and Lactation on the Oxidative Balance and Hepatic Metabolism of Female Rats.Nutrients. 2025 Jul 4;17(13):2219. doi: 10.3390/nu17132219. Nutrients. 2025. PMID: 40647324 Free PMC article.
-
The Effects of Whole-Body Vibration Exercise Combined With an Isocaloric High-Fructose Diet on Osteoporosis and Immunomodulation in Ovariectomized Mice.Front Nutr. 2022 Jun 20;9:915483. doi: 10.3389/fnut.2022.915483. eCollection 2022. Front Nutr. 2022. PMID: 35795589 Free PMC article.
References
LinkOut - more resources
Full Text Sources
Other Literature Sources
Miscellaneous
