

Detecting space-time clusters of COVID-19 in Brazil: mortality, inequality, socioeconomic vulnerability, and the relative risk of the disease in Brazilian municipalities
- PMID: 33716567
- PMCID: PMC7938278
- DOI: 10.1007/s10109-020-00344-0
Detecting space-time clusters of COVID-19 in Brazil: mortality, inequality, socioeconomic vulnerability, and the relative risk of the disease in Brazilian municipalities
Abstract
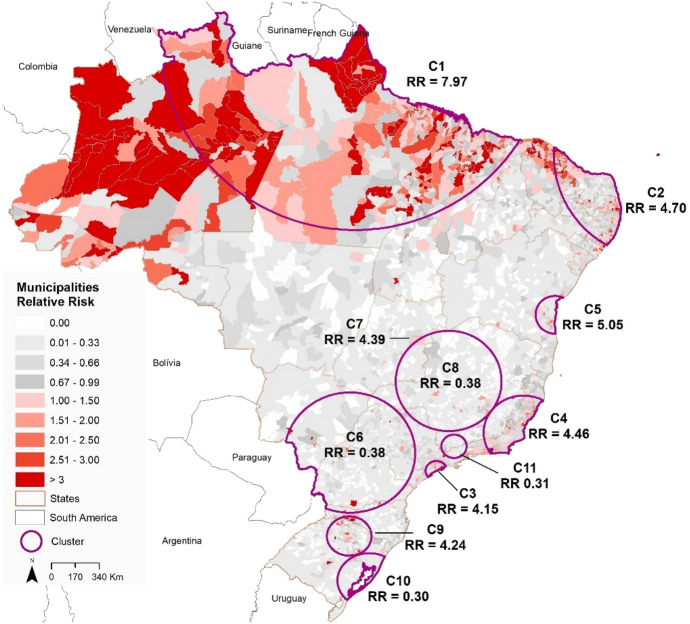
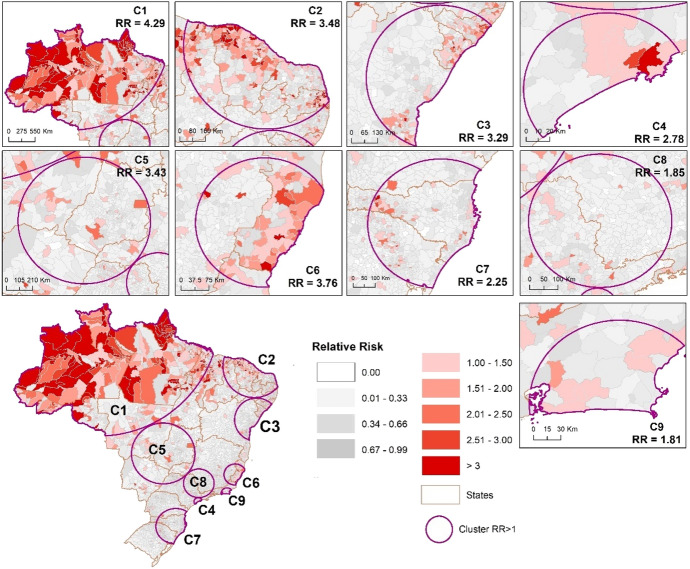
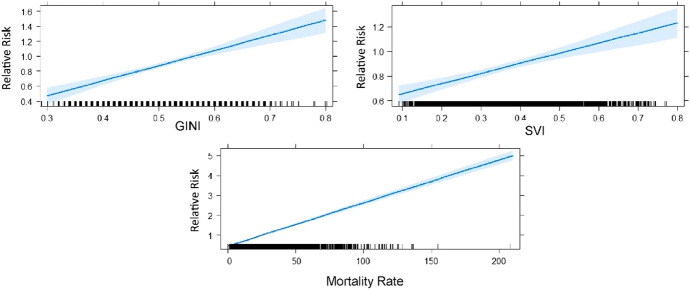
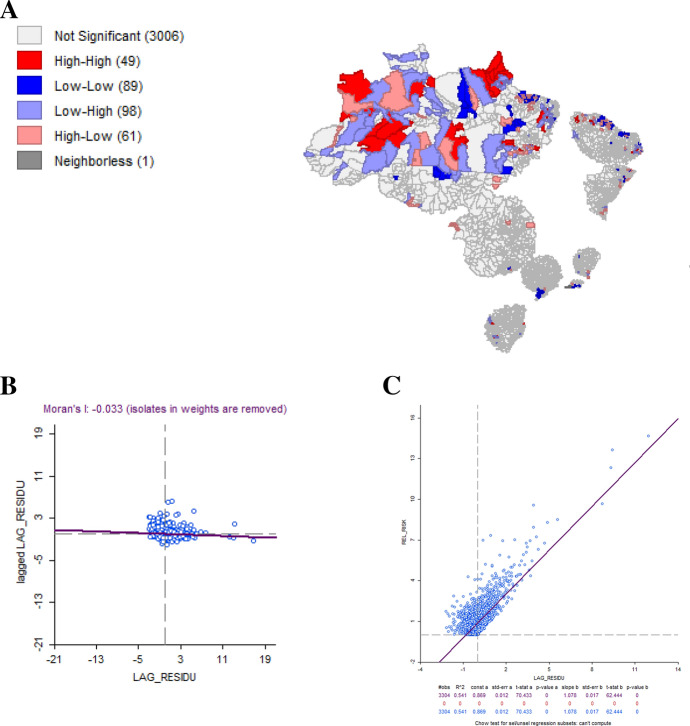
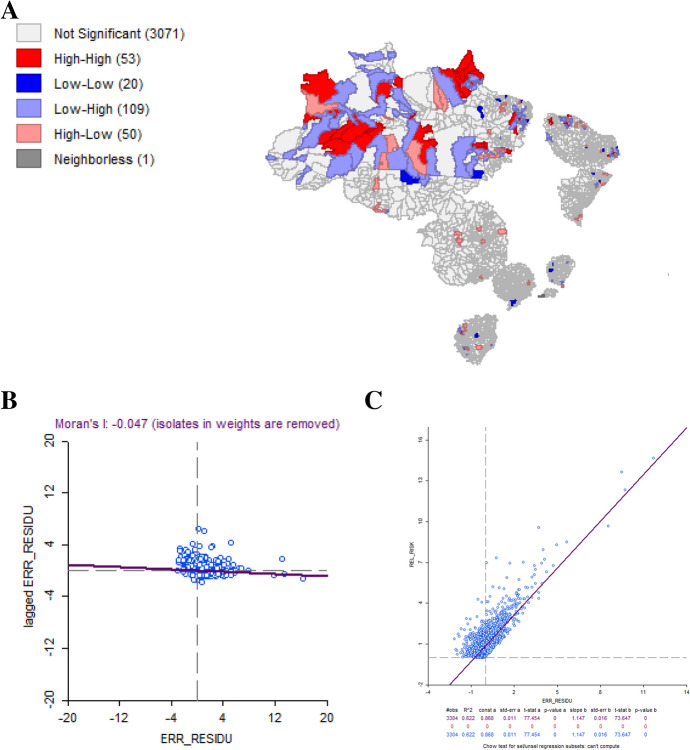
The first case of COVID-19 in South America occurred in Brazil on February 25, 2020. By July 20, 2020, there were 2,118,646 confirmed cases and 80,120 confirmed deaths. To assist with the development of preventive measures and targeted interventions to combat the pandemic in Brazil, we present a geographic study to detect "active" and "emerging" space-time clusters of COVID-19. We document the relationship between relative risk of COVID-19 and mortality, inequality, socioeconomic vulnerability variables. We used the prospective space-time scan statistic to detect daily COVID-19 clusters and examine the relative risk between February 25-June 7, 2020, and February 25-July 20, 2020, in 5570 Brazilian municipalities. We apply a Generalized Linear Model (GLM) to assess whether mortality rate, GINI index, and social inequality are predictors for the relative risk of each cluster. We detected 7 "active" clusters in the first time period, being one in the north, two in the northeast, two in the southeast, one in the south, and one in the capital of Brazil. In the second period, we found 9 clusters with RR > 1 located in all Brazilian regions. The results obtained through the GLM showed that there is a significant positive correlation between the predictor variables in relation to the relative risk of COVID-19. Given the presence of spatial autocorrelation in the GLM residuals, a spatial lag model was conducted that revealed that spatial effects, and both GINI index and mortality rate were strong predictors in the increase in COVID-19 relative risk in Brazil. Our research can be utilized to improve COVID-19 response and planning in all Brazilian states. The results from this study are particularly salient to public health, as they can guide targeted intervention measures, lowering the magnitude and spread of COVID-19. They can also improve resource allocation such as tests and vaccines (when available) by informing key public health officials about the highest risk areas of COVID-19.
Keywords: COVID-19; Disease surveillance; Geographic information systems; Relative risk; Space–time statistics; Spatial models.
© The Author(s) 2021.
Conflict of interest statement
Conflict of interestThe authors declare that they have no competing interests.
Figures


References
-
- Aleixo NCR, Neto JCADS, Pereira HDS, Barbosa DES, Lorenzi BC. Pelos caminhos das águas: a mobilidade e evolução da COVID-19 no estado do Amazonas. Confins Revue franco-brésilienne de géographie. 2020 doi: 10.4000/confins.30072. - DOI
-
- Alkhamis Moh A, Youha Sarah Al, Khajah Mohammad M, Haider Nour Ben, Alhardan Sumayah, Nabeel Ahmad, Mazeedi Sulaiman Al, Al-Sabah Salman K. Spatiotemporal dynamics of the COVID-19 pandemic in the State of Kuwait. Int J Infect Dis. 2020;98:153–160. doi: 10.1016/j.ijid.2020.06.078. - DOI - PMC - PubMed
-
- Allévius B, Höhle M (2019) Prospective detection of outbreaks. Handbook of infectious disease data analysis, 411
LinkOut - more resources
Full Text Sources
Other Literature Sources