Regulation of pyruvate dehydrogenase complex related to lactate switch in CHO cells
- PMID: 33716610
- PMCID: PMC7923601
- DOI: 10.1002/elsc.202000037
Regulation of pyruvate dehydrogenase complex related to lactate switch in CHO cells
Abstract
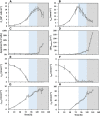
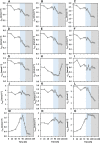
The metabolism of Chinese hamster ovary (CHO) cell lines is typically characterized by high rates of aerobic glycolysis with increased lactate formation, known as the "Warburg" effect. Although this metabolic state can switch to lactate consumption, the involved regulations of the central metabolism have only been partially studied so far. An important reaction transferring the lactate precursor, pyruvate, into the tricarboxylic acid cycle is the decarboxylation reaction catalyzed by the pyruvate dehydrogenase enzyme complex (PDC). Among other mechanisms, PDC is mainly regulated by phosphorylation-dephosphorylation at the three sites Ser232, Ser293, and Ser300. In this work, the PDC phosphorylation in antibody-producing CHO DP-12 cell culture is investigated during the lactate switch. Batch cultivations were carried out with frequent sampling (every 6 h) during the transition from lactate formation to lactate uptake, and the PDC phosphorylation levels were quantified using a novel indirect flow cytometry protocol. Contrary to the expected activation of PDC (i.e., reduced PDC phosphorylation) during lactate consumption, Ser293 and Ser300 phosphorylation levels were 33% higher compared to the phase of glucose excess. At the same time, the relative phosphorylation level of Ser232 increased steadily throughout the cultivation (66% increase overall). The intracellular pyruvate was found to accumulate only during the period of high lactate production, while acetyl-CoA showed nearly no accumulation. These results indicate a deactivation of PDC and reduced oxidative metabolism during lactate switch even though the cells undergo a metabolic transition to lactate-based cell growth and metabolism. Overall, this study provides a unique view on the regulation of PDC during the lactate switch, which contributes to an improved understanding of PDC and its interaction with the bioprocess.
Keywords: PDC phosphorylation; Warburg effect; dynamic enzyme regulation; lactate switch.
© 2020 The Authors. Engineering in Life Sciences published by Wiley‐VCH GmbH.
Figures


References
-
- Walsh, G. , Biopharmaceutical benchmarks 2014. Nat. Biotechnol. 2014, 32, 992–1000. - PubMed
-
- Lalonde, M.‐E. , Durocher, Y. , Therapeutic glycoprotein production in mammalian cells. J. Biotechnol. 2017, 251, 128–140. - PubMed
-
- Walsh, G. , Biopharmaceutical benchmarks 2018. Nat. Biotechnol. 2018, 36, 1136–1145. - PubMed
-
- Lim, Y. , Wong, N. S. C. , Lee, Y. Y. , Ku, S. C. Y. et al., Engineering mammalian cells in bioprocessing—current achievements and future perspectives. Biotechnol. Appl. Biochem. 2010, 55, 175–189. - PubMed
-
- Mulukutla, B. C. , Yongky, A. , Le, T. , Mashek, D. G. et al., Regulation of glucose metabolism; a perspective from cell bioprocessing. Trends Biotechnol. 2016, 34, 638–651. - PubMed
LinkOut - more resources
Full Text Sources
