Aging Alters Daily and Regional Calretinin Neuronal Expression in the Rat Non-image Forming Visual Thalamus
- PMID: 33716710
- PMCID: PMC7943479
- DOI: 10.3389/fnagi.2021.613305
Aging Alters Daily and Regional Calretinin Neuronal Expression in the Rat Non-image Forming Visual Thalamus
Abstract
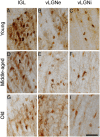
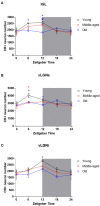
Aging affects the overall physiology, including the image-forming and non-image forming visual systems. Among the components of the latter, the thalamic retinorecipient inter-geniculate leaflet (IGL) and ventral lateral geniculate (vLGN) nucleus conveys light information to subcortical regions, adjusting visuomotor, and circadian functions. It is noteworthy that several visual related cells, such as neuronal subpopulations in the IGL and vLGN are neurochemically characterized by the presence of calcium binding proteins. Calretinin (CR), a representative of such proteins, denotes region-specificity in a temporal manner by variable day-night expression. In parallel, age-related brain dysfunction and neurodegeneration are associated with abnormal intracellular concentrations of calcium. Here, we investigated whether daily changes in the number of CR neurons are a feature of the aged IGL and vLGN in rats. To this end, we perfused rats, ranging from 3 to 24 months of age, within distinct phases of the day, namely zeitgeber times (ZTs). Then, we evaluated CR immunolabeling through design-based stereological cell estimation. We observed distinct daily rhythms of CR expression in the IGL and in both the retinorecipient (vLGNe) and non-retinorecipient (vLGNi) portions of the vLGN. In the ZT 6, the middle of the light phase, the CR cells are reduced with aging in the IGL and vLGNe. In the ZT 12, the transition between light to dark, an age-related CR loss was found in all nuclei. While CR expression predominates in specific spatial domains of vLGN, age-related changes appear not to be restricted at particular portions. No alterations were found in the dark/light transition or in the middle of the dark phase, ZTs 0, and 18, respectively. These results are relevant in the understanding of how aging shifts the phenotype of visual related cells at topographically organized channels of visuomotor and circadian processing.
Keywords: aging; calcium binding proteins; calretinin; circadian rhythms; intergeniculate leaflet; lateral geniculate body; stereology; ventral lateral geniculate nucleus.
Copyright © 2021 Fiuza, Queiroz, Aquino, Câmara, Brandão, Lima, Cavalcanti, Engelberth and Cavalcante.
Conflict of interest statement
The authors declare that the research was conducted in the absence of any commercial or financial relationships that could be construed as a potential conflict of interest.
Figures


Similar articles
-
Commissural communication allows mouse intergeniculate leaflet and ventral lateral geniculate neurons to encode interocular differences in irradiance.J Physiol. 2018 Nov;596(22):5461-5481. doi: 10.1113/JP276917. Epub 2018 Oct 23. J Physiol. 2018. PMID: 30240498 Free PMC article.
-
Diverse GABAergic neurons organize into subtype-specific sublaminae in the ventral lateral geniculate nucleus.J Neurochem. 2021 Nov;159(3):479-497. doi: 10.1111/jnc.15101. Epub 2020 Jun 24. J Neurochem. 2021. PMID: 32497303 Free PMC article.
-
The ventral lateral geniculate nucleus and the intergeniculate leaflet: interrelated structures in the visual and circadian systems.Neurosci Biobehav Rev. 1997 Sep;21(5):705-27. doi: 10.1016/s0149-7634(96)00019-x. Neurosci Biobehav Rev. 1997. PMID: 9353800 Review.
-
Region-specific glial hyperplasia and neuronal stability of rat lateral geniculate nucleus during aging.Exp Gerontol. 2017 Dec 15;100:91-99. doi: 10.1016/j.exger.2017.11.001. Epub 2017 Nov 4. Exp Gerontol. 2017. PMID: 29113752
-
Calcium-binding proteins in the human developing brain.Adv Anat Embryol Cell Biol. 2002;165:III-IX, 1-92. Adv Anat Embryol Cell Biol. 2002. PMID: 12236093 Review.
Cited by
-
Neuronal number and somal volume in calbindin-expressing neurons of the marmoset dorsal lateral geniculate nucleus are preserved during aging.PLoS One. 2025 May 23;20(5):e0323906. doi: 10.1371/journal.pone.0323906. eCollection 2025. PLoS One. 2025. PMID: 40408448 Free PMC article.
-
Age, Education Years, and Biochemical Factors Are Associated with Selective Neuronal Changes in the Elderly Hippocampus.Cells. 2022 Dec 13;11(24):4033. doi: 10.3390/cells11244033. Cells. 2022. PMID: 36552799 Free PMC article.
-
Localization of Calretinin, Parvalbumin, and S100 Protein in Nothobranchius guentheri Retina: A Suitable Model for the Retina Aging.Life (Basel). 2023 Oct 13;13(10):2050. doi: 10.3390/life13102050. Life (Basel). 2023. PMID: 37895432 Free PMC article.
-
Inner Structure of the Lateral Geniculate Complex of Adult and Newborn Acomys cahirinus.Int J Mol Sci. 2024 Jul 18;25(14):7855. doi: 10.3390/ijms25147855. Int J Mol Sci. 2024. PMID: 39063096 Free PMC article.
References
LinkOut - more resources
Full Text Sources
Other Literature Sources

