

EEG Power Spectral Analysis of Abnormal Cortical Activations During REM/NREM Sleep in Obstructive Sleep Apnea
- PMID: 33716946
- PMCID: PMC7953149
- DOI: 10.3389/fneur.2021.643855
EEG Power Spectral Analysis of Abnormal Cortical Activations During REM/NREM Sleep in Obstructive Sleep Apnea
Abstract
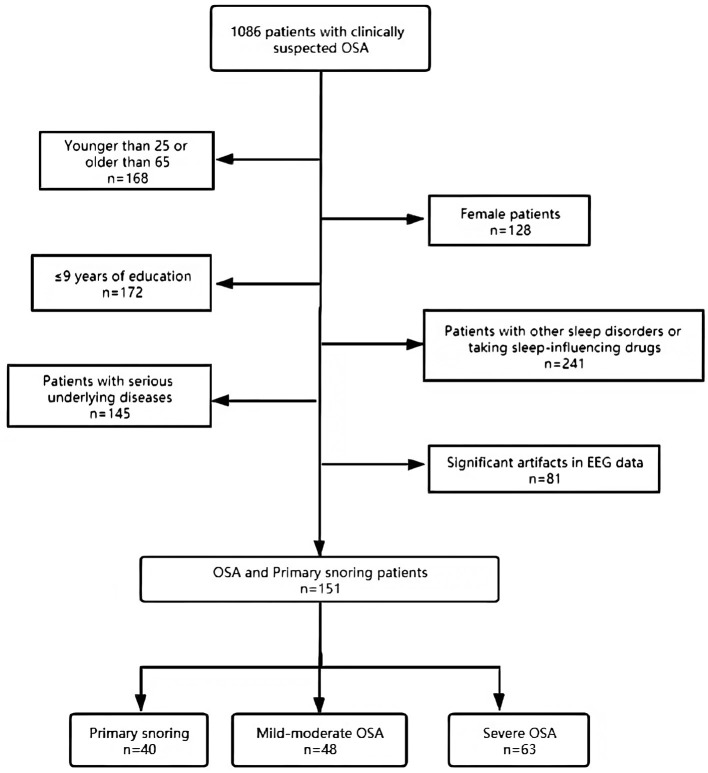
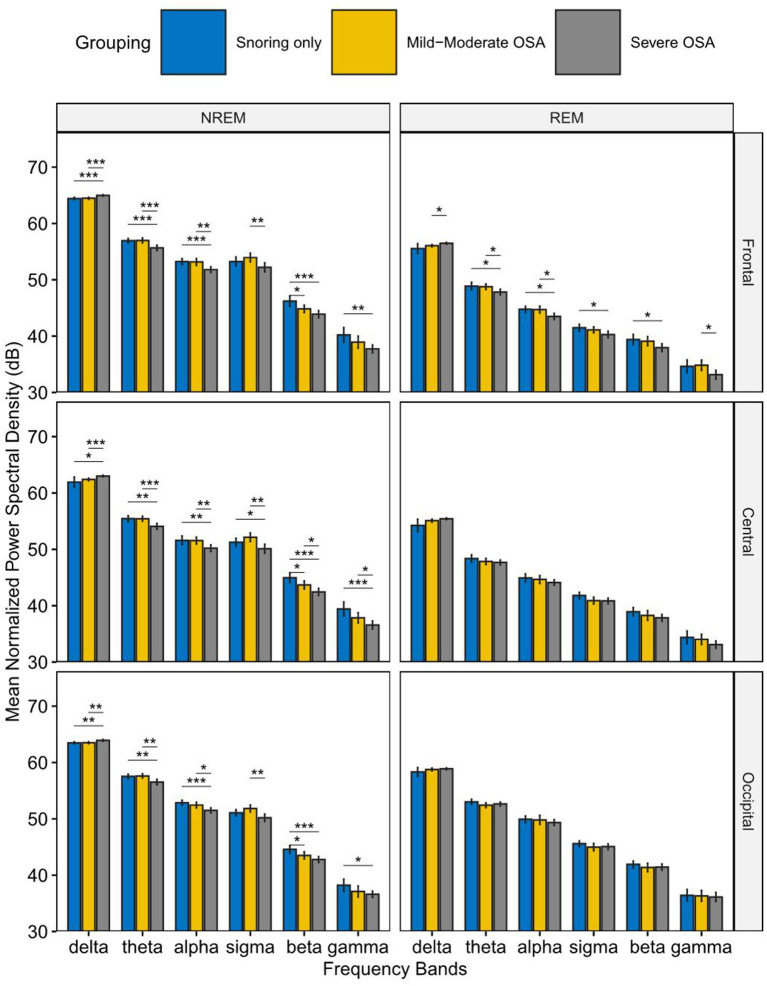
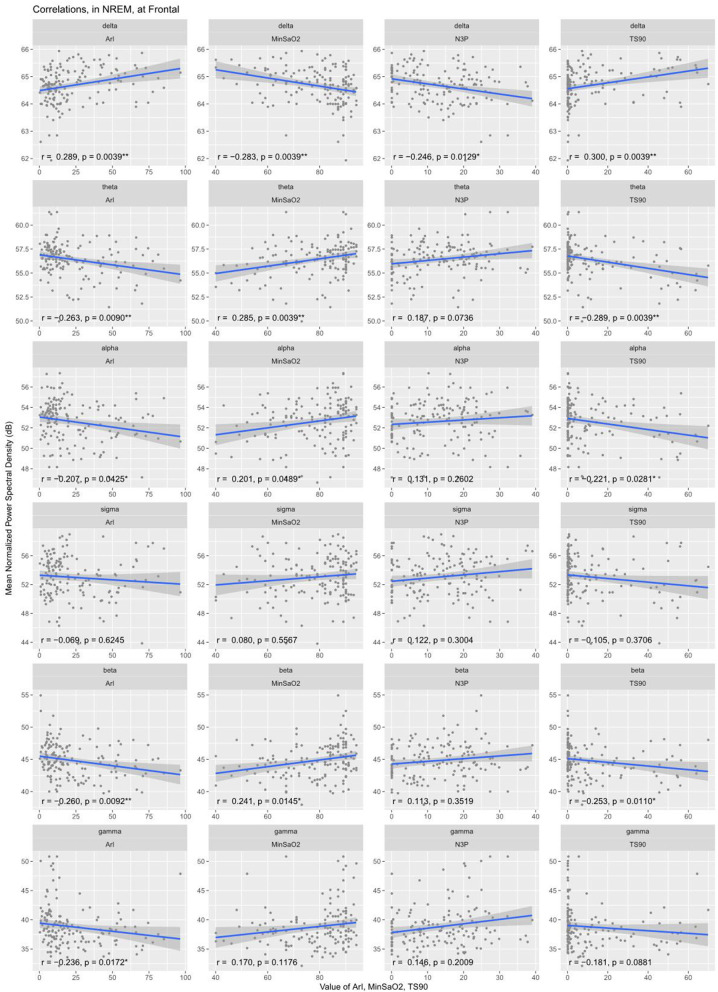
Objective: To characterize electroencephalogram (EEG) power in different frequency bands during rapid eye movement (REM) sleep and non-rapid eye movement (NREM) sleep in patients with obstructive sleep apnea (OSA). Methods: Retrospective data on 151 patients were collected and divided into three groups: primary snoring group (AHI < 5/h), mild-moderate OSA group (6 ≤ AHI < 30/h), and severe OSA group (AHI ≥ 30/h). EEG recordings in the frontal, central, and occipital regions were extracted from both REM and NREM sleep, to compute the normalized spectral power densities in the delta, theta, alpha, sigma, beta, and gamma frequency bands, using Fast Fourier Transform. Correlations between the computed EEG power and PSG parameters were analyzed. Results: In NREM sleep, elevated normalized power spectral density (PSD) in the delta band was observed in the severe OSA group compared to the other two groups. In contrast, the PSD of the other frequency bands showed a corresponding decrease in the severe OSA group. In REM sleep, similar changes were observed in the frontal region. Delta band PSD was positively correlated with Apnea Hypopnea Index (AHI) (r = 0.33), longest time of apnea, oxygen desaturation index (ODI) (r = 0.34), percent sleep time below 90% SaO2 (T90%) (r = 0.30), Arousal Index (ArI) (r = 0.29), and negatively correlated with N3%, minimum oxygen saturation (minSaO2). Conclusion: Our findings provide neurophysiological evidence for pathological cortical activation during REM/NREM sleep, which may be associated with the arousals and cognitive impairments in OSA. The technique of power spectral analysis could prove a potentially useful tool in complementing traditional PSG parameters in assessing disease burden to guide therapeutic decisions.
Keywords: REM and NREM sleep; normalized EEG power; obstructive sleep apnea; polysomnography; power spectral analysis.
Copyright © 2021 Liu, Shen, Li, Wang, Wang, Xu, Wang and Chen.
Conflict of interest statement
The authors declare that the research was conducted in the absence of any commercial or financial relationships that could be construed as a potential conflict of interest.
Figures
References
LinkOut - more resources
Full Text Sources
Other Literature Sources