

Proteomic and Structural Manifestations of Cardiomyopathy in Rat Models of Obesity and Weight Loss
- PMID: 33716957
- PMCID: PMC7945951
- DOI: 10.3389/fendo.2021.568197
Proteomic and Structural Manifestations of Cardiomyopathy in Rat Models of Obesity and Weight Loss
Abstract
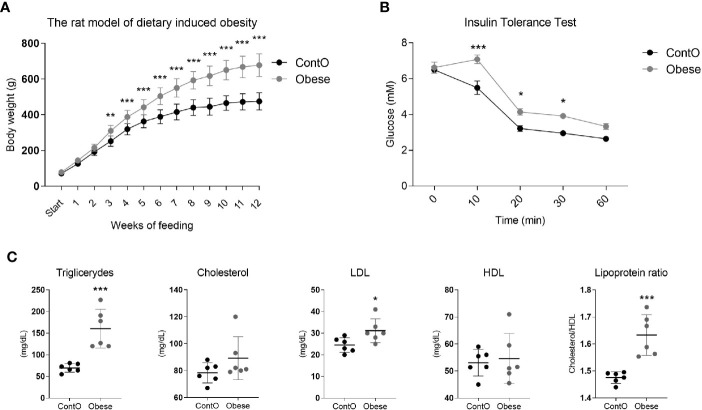
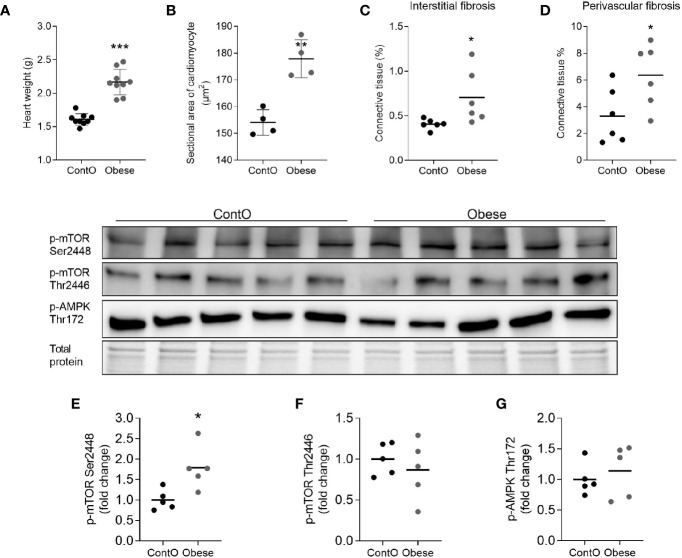
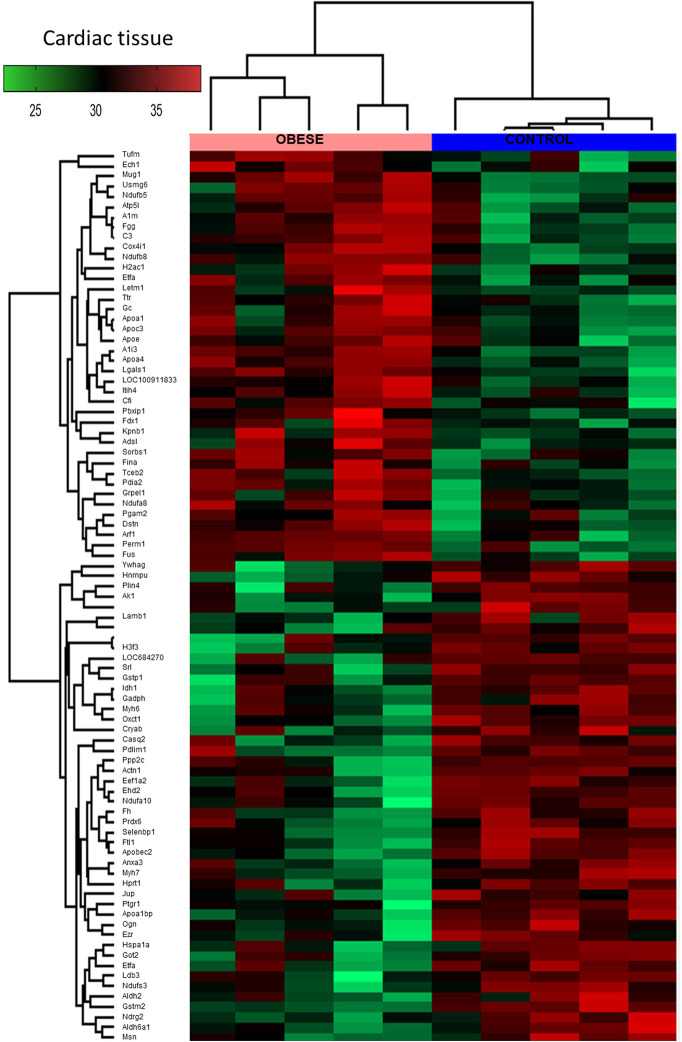
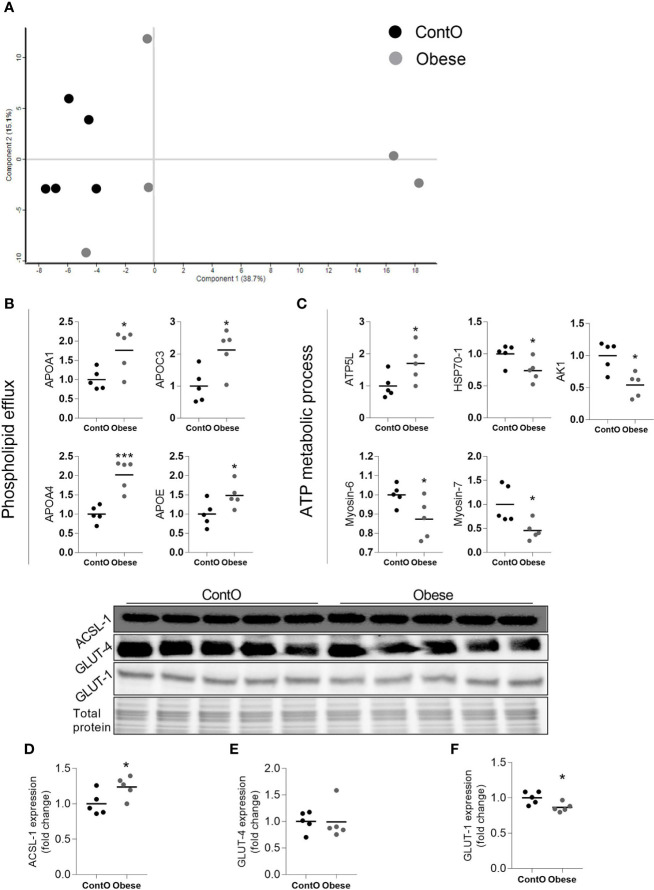
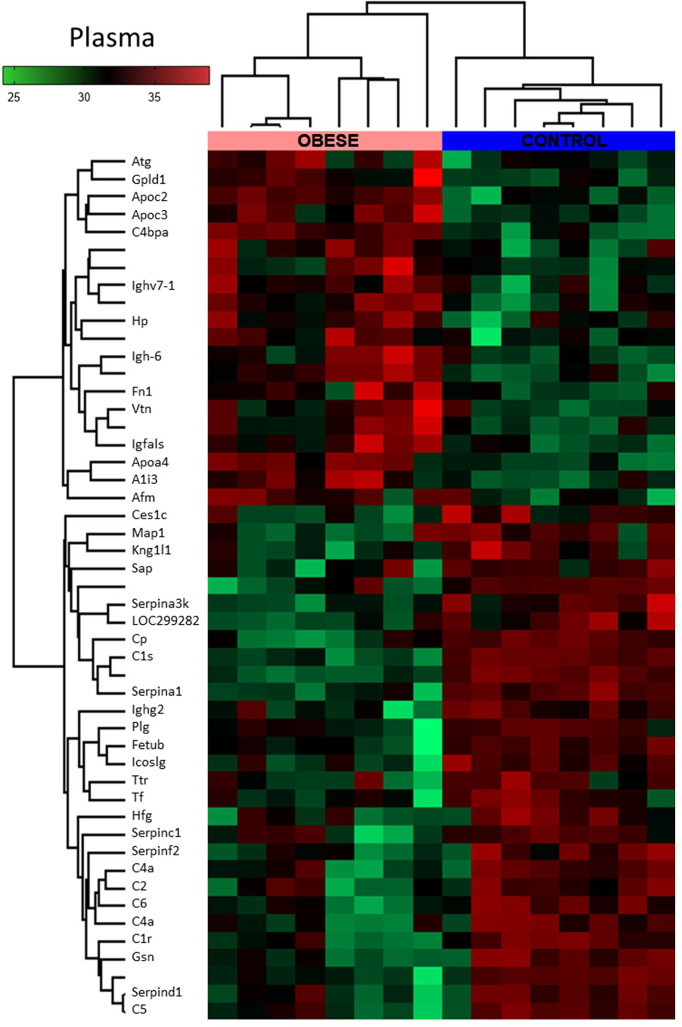
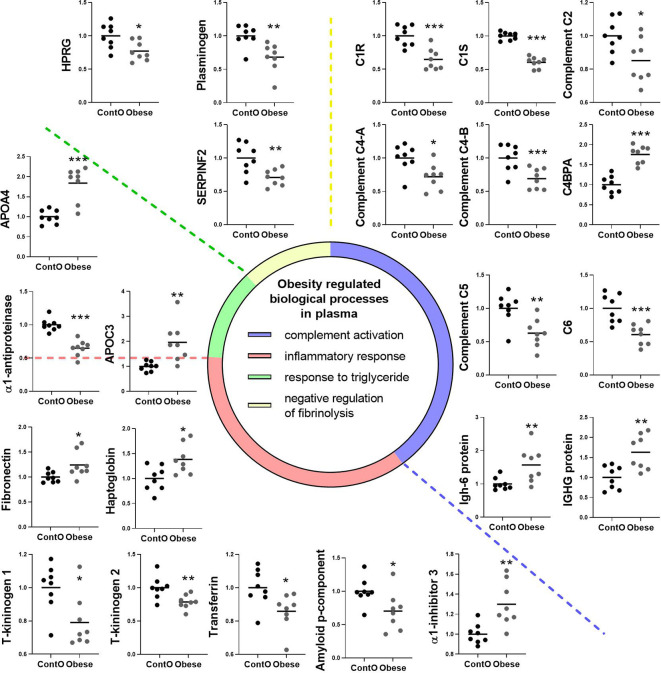
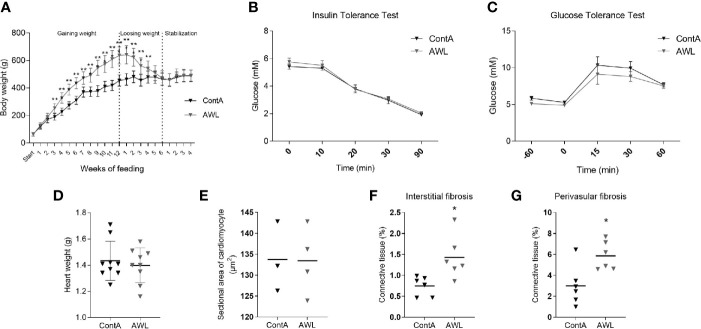
Obesity cardiomyopathy increases the risk of heart failure and death. Obesity is curable, leading to the restoration of the heart phenotype, but it is not clear if there are any after-effects of obesity present after weight loss. We characterize the proteomic landscape of obesity cardiomyopathy with an evaluation of whether the cardiac phenotype is still shaped after weight loss. Cardiomyopathy was validated by cardiac hypertrophy, fibrosis, oversized myocytes, and mTOR upregulation in a rat model of cafeteria diet-induced developmental obesity. By global proteomic techniques (LC-MS/MS) a plethora of molecular changes was observed in the heart and circulation of obese animals, suggesting abnormal utilization of metabolic substrates. This was confirmed by increased levels of cardiac ACSL-1, a key enzyme for fatty acid degradation and decreased GLUT-1, a glucose transporter in obese rats. Calorie restriction and weight loss led to the normalization of the heart's size, but fibrosis was still excessive. The proteomic compositions of cardiac tissue and plasma were different after weight loss as compared to control. In addition to morphological consequences, obesity cardiomyopathy involves many proteomic changes. Weight loss provides for a partial repair of the heart's architecture, but the trace of fibrotic deposition and proteomic alterations may occur.
Keywords: cafeteria diet; caloric restriction; cardiac fibrosis; developmental obesity; heart proteomics; obesity cardiomyopathy; plasma proteomics; weight loss.
Copyright © 2021 Liśkiewicz, Marczak, Bogus, Liśkiewicz, Przybyła and Lewin-Kowalik.
Conflict of interest statement
The authors declare that the research was conducted in the absence of any commercial or financial relationships that could be construed as a potential conflict of interest.
Figures
Similar articles
-
High-fructose and high-fat feeding correspondingly lead to the development of lysoPC-associated apoptotic cardiomyopathy and adrenergic signaling-related cardiac hypertrophy.Int J Cardiol. 2016 Jul 15;215:65-76. doi: 10.1016/j.ijcard.2016.03.239. Epub 2016 Apr 13. Int J Cardiol. 2016. PMID: 27107546
-
Characterization of a mouse model of obesity-related fibrotic cardiomyopathy that recapitulates features of human heart failure with preserved ejection fraction.Am J Physiol Heart Circ Physiol. 2018 Oct 1;315(4):H934-H949. doi: 10.1152/ajpheart.00238.2018. Epub 2018 Jul 13. Am J Physiol Heart Circ Physiol. 2018. PMID: 30004258 Free PMC article.
-
Dietary salt restriction improves cardiac and adipose tissue pathology independently of obesity in a rat model of metabolic syndrome.J Am Heart Assoc. 2014 Dec 2;3(6):e001312. doi: 10.1161/JAHA.114.001312. J Am Heart Assoc. 2014. PMID: 25468654 Free PMC article.
-
Is there a cardiomyopathy of obesity?Curr Heart Fail Rep. 2007 Dec;4(4):221-8. doi: 10.1007/s11897-007-0016-3. Curr Heart Fail Rep. 2007. PMID: 18221619 Review.
-
Management of obesity cardiomyopathy.Am J Med Sci. 2001 Apr;321(4):237-41. doi: 10.1097/00000441-200104000-00004. Am J Med Sci. 2001. PMID: 11307865 Review.
Cited by
-
Effects of High-Fat Diet on Cardiovascular Protein Expression in Mice Based on Proteomics.Diabetes Metab Syndr Obes. 2023 Mar 28;16:873-882. doi: 10.2147/DMSO.S405327. eCollection 2023. Diabetes Metab Syndr Obes. 2023. PMID: 37012931 Free PMC article.
-
Effects of Semaglutide on Cardiac Protein Expression and Cardiac Function of Obese Mice.J Inflamm Res. 2022 Nov 24;15:6409-6425. doi: 10.2147/JIR.S391859. eCollection 2022. J Inflamm Res. 2022. PMID: 36452054 Free PMC article.
-
UTP14A, DKC1, DDX10, PinX1, and ESF1 Modulate Cardiac Angiogenesis Leading to Obesity-Induced Cardiac Injury.J Diabetes Res. 2022 Jun 13;2022:2923291. doi: 10.1155/2022/2923291. eCollection 2022. J Diabetes Res. 2022. PMID: 35734237 Free PMC article.
-
Effect of high-fat diet and empagliflozin on cardiac proteins in mice.Nutr Metab (Lond). 2022 Oct 14;19(1):69. doi: 10.1186/s12986-022-00705-0. Nutr Metab (Lond). 2022. PMID: 36242090 Free PMC article.
References
-
- (NCD-RisC) NCDRFC . Worldwide trends in body-mass index, underweight, overweight, and obesity from 1975 to 2016: a pooled analysis of 2416 population-based measurement studies in 128·9 million children, adolescents, and adults. Lancet (London England) (2017) 390:2627–42. 10.1016/S0140-6736(17)32129-3 - DOI - PMC - PubMed
Publication types
MeSH terms
Substances
LinkOut - more resources
Full Text Sources
Other Literature Sources
Medical
Molecular Biology Databases
Miscellaneous