. 2021 Feb 26:12:631140.
doi: 10.3389/fmicb.2021.631140. eCollection 2021.

Low Bifidobacterium Abundance in the Lower Gut Microbiota Is Associated With Helicobacter pylori-Related Gastric Ulcer and Gastric Cancer

Affiliations

Low Bifidobacterium Abundance in the Lower Gut Microbiota Is Associated With Helicobacter pylori-Related Gastric Ulcer and Gastric Cancer

T Barani Devi et al. Front Microbiol. .

Abstract

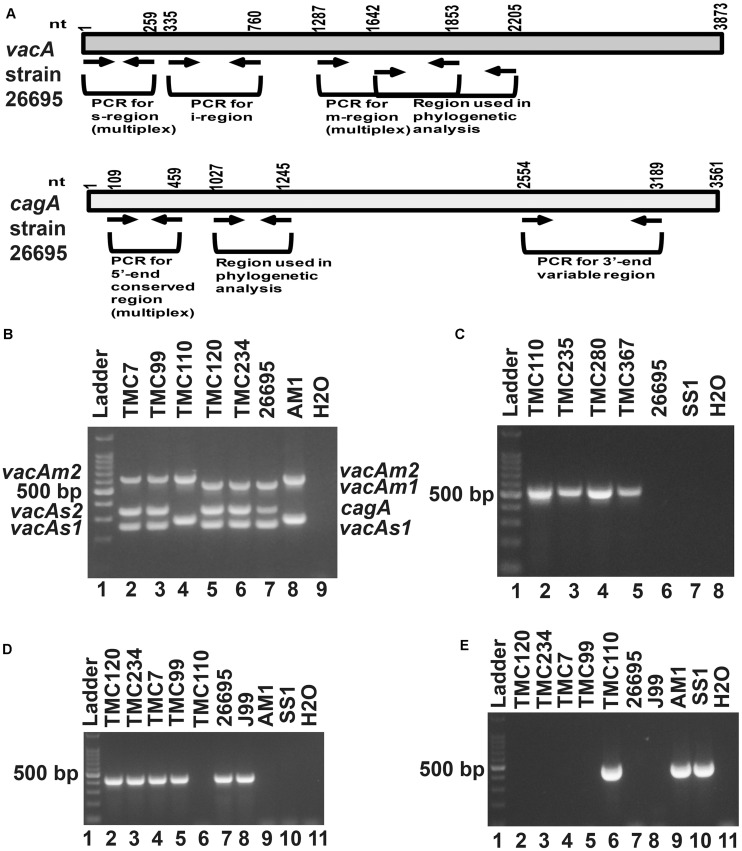
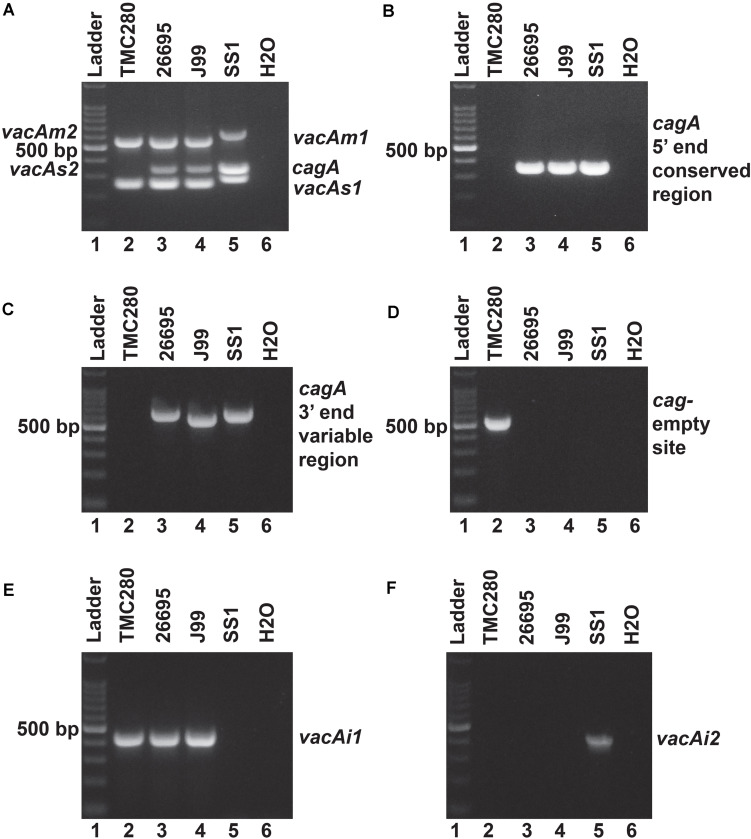
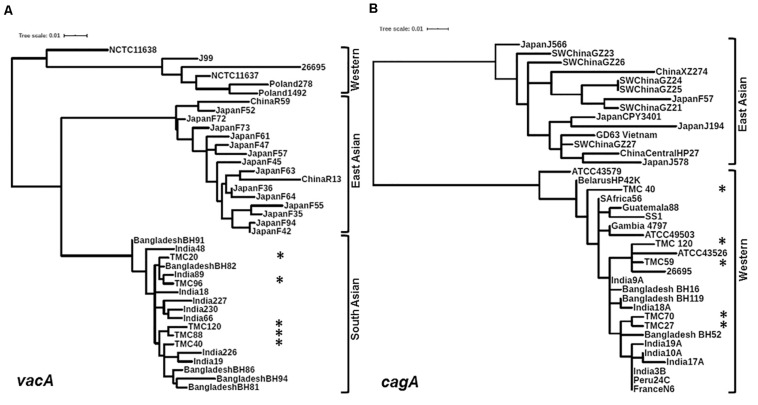
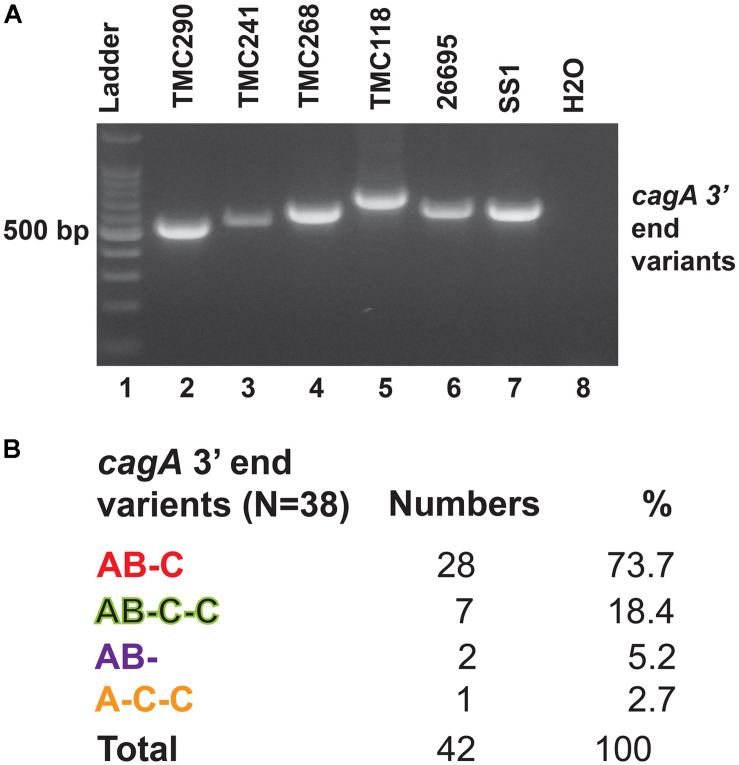
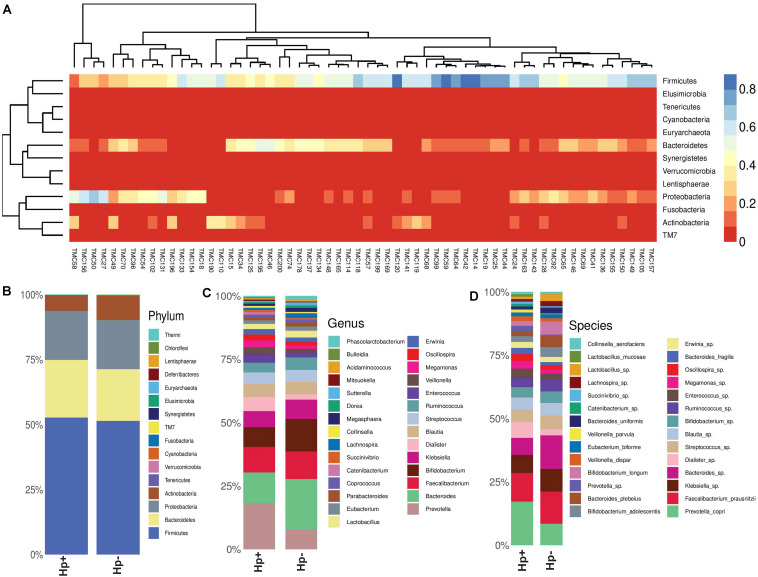
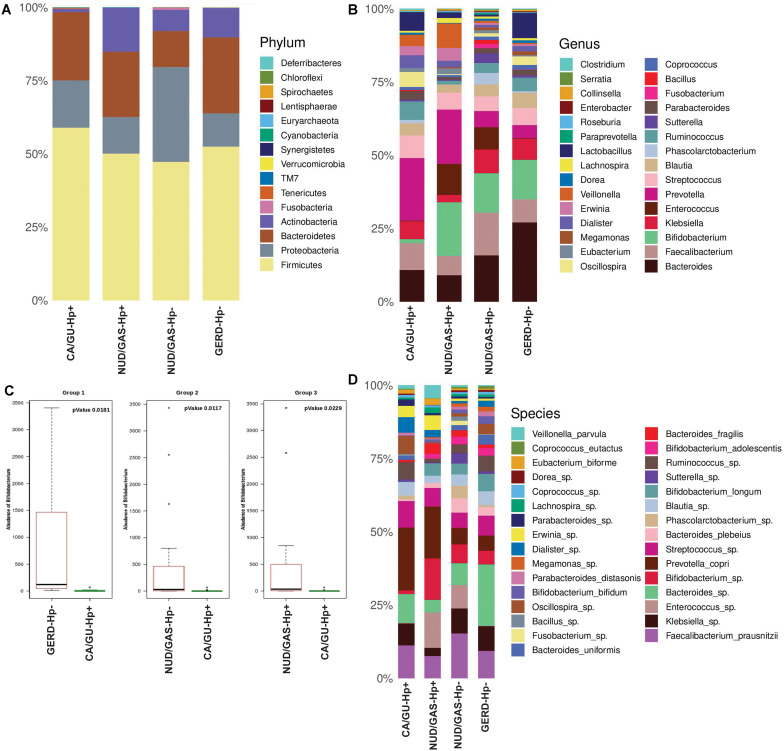
Helicobacter pylori infection in stomach leads to gastric cancer, gastric ulcer, and duodenal ulcer. More than 1 million people die each year due to these diseases, but why most H. pylori-infected individuals remain asymptomatic while a certain proportion develops such severe gastric diseases remained an enigma. Several studies indicated that gastric and intestinal microbiota may play a critical role in the development of the H. pylori-associated diseases. However, no specific microbe in the gastric or intestinal microbiota has been clearly linked to H. pylori infection and related gastric diseases. Here, we studied H. pylori infection, its virulence genes, the intestinal microbiota, and the clinical status of Trivandrum residents (N = 375) in southwestern India by standard H. pylori culture, PCR genotype, Sanger sequencing, and microbiome analyses using Illumina Miseq and Nanopore GridION. Our analyses revealed that gastric colonization by virulent H. pylori strains (vacAs1i1m1cagA+) is necessary but not sufficient for developing these diseases. Conversely, distinct microbial pools exist in the lower gut of the H. pylori-infected vs. H. pylori-non-infected individuals. Bifidobacterium (belonging to the phylum Actinobacteria) and Bacteroides (belonging to the phylum Bacteroidetes) were present in lower relative abundance for the H. pylori+ group than the H. pylori- group (p < 0.05). On the contrary, for the H. pylori+ group, genus Dialister (bacteria belonging to the phylum Firmicutes) and genus Prevotella (bacteria belonging to the phylum Bacteroidetes) were present in higher abundance compared to the H. pylori- group (p < 0.05). Notably, those who carried H. pylori in the stomach and had developed aggressive gastric diseases also had extremely low relative abundance (p < 0.05) of several Bifidobacterium species (e.g., B. adolescentis, B. longum) in the lower gut suggesting a protective role of Bifidobacterium. Our results show the link between lower gastrointestinal microbes and upper gastrointestinal diseases. Moreover, the results are important for developing effective probiotic and early prognosis of severe gastric diseases.

Keywords: Bifidobacterium; H. pylori; gastric ulcer and cancer; gut microbiome; probiotic.


Conflict of interest statement

AG was employed by the company Genotypic Technology Pvt. Ltd, Bengaluru, Karnataka, India. The NGS was outsourced to this company. Some of the analysis was done by AG upon request in the absence of any commercial or financial relationships. The remaining authors declare that the research was conducted in the absence of any commercial or financial relationships that could be construed as a potential conflict of interest.

Figures

FIGURE 1
FIGURE 1
(A) Schematic diagram of the vacuolating cytotoxin A (vacA) and cytotoxin associated gene A (cagA) of the genome sequenced strain, 26,695 showing the nucleotide positions. The regions used in the analyses are indicated. (B) Multiplex PCR for genotyping the vacAs1, vacAs2, vacAm1, vacAm2, and cagA of H. pylori. The strains TMC7 and TMC99 (lane 2 and 3) have vacAs1m2cagA+; the strain TMC110 (lane 4) has vacAs2m2cagA–; the strains TMC120 and TMC234 (Lanes 5 and 6) have vacAs1m1cagA+ genotypes. The strains 26,695 (lane 7) and AM1 (lane 8) were used as positive controls for vacAs1m1cagA+ and vacAs2m2cagA- genotypes, respectively. Water (lane 9) was used as negative control. (C) The strains, TMC110, TMC235, TMC280, TMC367, which did not give amplicon for cagA in multiplex PCR, gave amplicon for the cag-empty site PCR. (D) PCR for the detection of vacAi1 allele. The strains TMC120, TMC 234, TMC7, and TMC99 were found to carry the vacAi1 allele, while the strain TMC110 did not give the amplicon. (E) PCR for the detection of vacAi2 allele. The strain TMC110 was found to carry the vacAi2 allele.
FIGURE 2
FIGURE 2
(A) Multiplex PCR for the characterization of vacA alleles and cagA gene of strain TMC280. The strain TMC280 carry vacAs1m1cagA- genotype, while the strains used as positive controls like 26,695 (vacAs1m1cagA+), J99 (vacAs1m1cagA+), and SS1 (vacAs2m2cagA–) gave amplicons at expected sizes. (B) No cagA specific amplicon were obtained for the strain TMC280 when the primers are targeted at the 5′ end conserved regions of the cagA gene. The positive controls, 26,695, J99, and SS, as expected, gave specific amplicons. (C) The PCR targeting the 3′ end variable region of the cagA gene. The strain TMC280 did not give any amplification with these primers, while the positive controls, 26,695, J99, and SS1, did. (D) The cag-empty site PCR. Only the strain TMC280, but not the strains 26,695, J99, and SS, gave amplicon for this PCR. (E) The PCR for the vacAi1 allele. The strain TMC280, along with 26,695 and J99, gave amplicon for the vacAi1 allele. The strain SS1, as expected did not give the vacAi1 specific amplicon. (F) The PCR for the vacAi2 allele. The strain TMC280 as well as the strains 26,695 and J99 were negative for this PCR, but the strain SS1 was positive. Therefore, it is confirmed that the strain TMC280 has vacAs1i1m1cagA- genotype.
FIGURE 3
FIGURE 3
(A) Phylogenetic analysis of the vacAm1. The vacAm1 of Trivandrum H. pylori strains (named as TMC and shown as asterisks) are closely related to the vacAm1 of the H. pylori strains from South Asia, but differ from the vacAm1 of H. pylori strains from Western world and East Asia. The H. pylori vacAm1 sequences and their GenBank accession numbers are: TMC20 (MN968508); TMC40 (MN968509); TMC88 (MN968510); TMC96 (MN968511); TMC120 (MN968512); NCTC 11638 (HPU07145); Poland 1492 (AF097570); Poland 278 (AF097571); NCTC 11637 (AF049653); J99 (AE001511); 26695 (AE000598); Japan F73 (AF049652); Japan F72 (AF049651); Japan F52 (AF049631); China R59 (AF035611); Japan F61 (AF049645); Japan F57 (AF049634); Japan F35 (AF049625); Japan F55 (AF049632); Japan F47 (AF049629); Japan F45 (AF049628); Japan F94 (AF049640); Japan F42 (AF049626); Japan F36 (AF049642); Japan F64 (AF049647); Japan F63 (AF049635); China R13 (AF035610); Bangladesh BH91 (LC187447); India 48 (AF220112); India 18 (AF220110); India 227 (AF220116); India 230 (AF220117); India 66 (AF220113); India 89 (AF220114); Bangladesh BH82 (LC187444); Bangladesh BH94 (LC187448); India 226 (AF220115); India 19 (AF220111); Bangladesh BH81 (LC187443); Bangladesh BH86 (LC187446). (B) Phylogenetic analysis of the cagA 5′ end conserved region. The cagA of H. pylori strains isolated from Trivandrum (named as TMC and shown as asterisks) formed cluster within the cagA of Western H. pylori strains and not with the East Asian H. pylori strains. The H. pylori cagA sequences and their accession numbers are: TMC27 (MN968503); TMC40 (MN968504); TMC120 (MN968505); TMC59 (MN968506); TMC70 (MN968507); SW China GZ26 (KR154755); SW China GZ23 (KR154752); XZ274 China (NC_017926); Japan J566 (AB017922); SW China GZ27 (KR154756); GD63 Vietnam (CP031558); Japan J578 (AB017923); China Central HP27 (DQ306710); Japan CPY3401 (AY121840); Japan J194 (AB017921); Japan F57 (AB190935); SW China GZ21 (KR154750); SW China GZ24 (KR154753); SW China GZ25 (KR154754); ATCC 43579 (AB015414); HP42K Belarus (NZ_CP034314); India 17A (AF202223); S Africa 56 (AF198471); Guatemala 88 (AF198472); ATCC 49503 (AB015415); Gambia 4797 (AF198469); SS1 (KR154757); Bangladesh BH16 (LC187624); India 9A (AF202221); Bangladesh BH119 (LC187626); India 18A (AF202224); ATCC 43526 (AB015413); 26695 (AE000511); Bangladesh BH52 (LC187641); India 3B (AF202219); India 10A (AF202222); India 19A (AF202225); Peru 24C (AF198473); N6 France (CAHX01000001 to CAHX01000054).
FIGURE 4
FIGURE 4
(A) PCR targeting the 3′ end variable regions of the cagA gene that encodes the EPIYA motifs. The amplicon sizes varied due to the variable number of EPIYA motifs and the spacer regions. (B) Different types of CagA types and their prevalence in Trivandrum. The nucleotide sequences (GenBank accession numbers MN968513 to MN968550) of the cagA genes were converted to the amino acid sequences and analyzed.
FIGURE 5
FIGURE 5
(A) Heat map showing the relative abundances of different phyla for each sample (N = 60). (B) Relative abundances of different phyla in gut shown in stacked column for the H. pylori+ (Hp+) and the H. pylori− (Hp−) groups. The Hp+ group has less relative abundance of the Phylum Actinobacteria. (C) Relative abundances of different genera in gut shown in stacked column for the H. pylori+ (Hp+; N = 30) and the H. pylori− (Hp−; N = 30) groups. The Hp+ group has less relative abundance of the genus Bifidobacterium. (D) Relative abundances of different bacterial species in gut shown in stacked column for the H. pylori+ (Hp+; N = 30) and the H. pylori− (Hp−; N = 30) groups. The Hp+ group has less relative abundance of the Bifidobacterium longum and B. adolescentis. The bacterial species that vary between the H. pylori+ and the H. pylori− groups are B. longum (Kruskal-Wallis, p = 0.009), B. adolescentis (p = 0.03), B. bividum (p = 0.004), B. plebeius (p = 0.05), B. uniformis (p = 0.04), and P. copri (p = 0.003).
FIGURE 6
FIGURE 6
(A) Relative abundances of different phyla in gut shown in stacked column for the CA/GU-Hp+, NUD/GAS-Hp+, NUD/GAS− Hp−, and GERD-Hp− groups. The CA/GU-Hp+ group have low relative abundance of Actinobacteria as compared to the other groups. (B) Relative abundances of different genera in gut shown in stacked column plot for the CA/GU-Hp+, NUD/GAS-Hp+, NUD/GAS- Hp−, and GERD-Hp− groups. Relative abundance of Bifidobacterium for the CA/GU-Hp+ group is significantly low. (C) Box plot analysis showing that the abundance of Bifidobacterium is significantly lower in the CA/GU-Hp+ group than the NUD/GAS-Hp+, NUD/GAS- Hp−, and GERD-Hp− groups. (D) Relative abundances of different bacterial species in gut shown in stacked column for the CA/GU-Hp+, NUD/GAS-Hp+, NUD/GAS- Hp−, and GERD-Hp− groups. Significantly low relative abundances of Bifidobacterium bifidum, Bifidobacterium adolescentis, and Bifidobacterium longum are identified for the CA/GU-Hp+ group.

Similar articles

Cited by

References

    1. Andersson A. F., Lindberg M., Jakobsson H., Backhed F., Nyren P., Engstrand L. (2008). Comparative analysis of human gut microbiota by barcoded pyrosequencing. PLoS One 3:e2836. 10.1371/journal.pone.0002836 - DOI - PMC - PubMed
    1. Atherton J. C., Cao P., Peek R. M., Jr., Tummuru M. K., Blaser M. J., Cover T. L. (1995). Mosaicism in vacuolating cytotoxin alleles of Helicobacter pylori. Association of specific vacA types with cytotoxin production and peptic ulceration. J. Biol. Chem. 270 17771–17777. 10.1074/jbc.270.30.17771 - DOI - PubMed
    1. Bag S., Saha B., Mehta O., Anbumani D., Kumar N., Dayal M., et al. (2016). An improved method for high quality metagenomics DNA extraction from human and environmental samples. Sci. Rep. 6:26775. 10.1038/srep26775srep26775 - DOI - PMC - PubMed
    1. Basso D., Zambon C. F., Letley D. P., Stranges A., Marchet A., Rhead J. L., et al. (2008). Clinical relevance of Helicobacter pylori cagA and vacA gene polymorphisms. Gastroenterology 135 91–99. 10.1053/j.gastro.2008.03.041S0016-5085(08)00479-4 - DOI - PubMed
    1. Berg D. E., Lelwala-Guruge J., Incecik E. T., Srivastava K., Akopyants N. S. (1997). H. pylori DNA fingerprinting using the arbitrarily primed PCR (AP-PCR) or random amplified polymorphic DNA (RAPD) method. Methods Mol. Med. 8 117–132. 10.1385/0-89603-381-3:117 - DOI - PubMed

LinkOut - more resources