. 2021 Feb 25:12:631346.
doi: 10.3389/fmicb.2021.631346. eCollection 2021.

Influenza B Virus Infection Is Enhanced Upon Heterotypic Co-infection With Influenza A Virus

Affiliations

Influenza B Virus Infection Is Enhanced Upon Heterotypic Co-infection With Influenza A Virus

Nicolas Malausse et al. Front Microbiol. .

Abstract

Homotypic co-infections with influenza viruses are described to increase genetic population diversity, to drive viral evolution and to allow genetic complementation. Less is known about heterotypic co-infections between influenza A (IAV) and influenza B (IBV) viruses. Previous publications showed that IAV replication was suppressed upon co-infection with IBV. However, the effect of heterotypic co-infections on IBV replication was not investigated. To do so, we produced by reverse genetics a pair of replication-competent recombinant IAV (A/WSN/33) and IBV (B/Brisbane/60/2008) expressing a GFP and mCherry fluorescent reporter, respectively. A549 cells were infected simultaneously or 1 h apart at a high MOI with IAV-GFP or IBV-mCherry and the fluorescence was measured at 6 h post-infection by flow cytometry. Unexpectedly, we observed that IBV-mCherry infection was enhanced upon co-infection with IAV-GFP, and more strongly so when IAV was added 1 h prior to IBV. The same effect was observed with wild-type viruses and with various strains of IAV. Using UV-inactivated IAV or type-specific antiviral compounds, we showed that the enhancing effect of IAV infection on IBV infection was dependent on transcription/replication of the IAV genome. Our results, taken with available data in the literature, support the hypothesis that the presence of IAV proteins can enhance IBV genome expression and/or complement IBV defective particles.

Keywords: co-infection; heterotypic; influenza B virus; influenza virus; viral interference.


Conflict of interest statement

The authors declare that the research was conducted in the absence of any commercial or financial relationships that could be construed as a potential conflict of interest.

Figures

FIGURE 1
FIGURE 1
Production and characterization of IAV-GFP and IBV-mCherry recombinant viruses. (A) Schematic representation of the IAV-PB2-GFP and IBV-PB2-mCherry segments. PB2: PB2 coding sequence from A/WSN/33 (760 aa) or B/Brisbane/60/2008 (770 aa) viral strains. Orange region: sequence encoding porcine teschovirus-1 2A peptide (22 aa) with AAA linker. GFP/mCherry: flu-codon-optimized sequence encoding the GFP (240 aa) or mCherry (236 aa) fluorescent protein. Gray hatched region: duplication of the last 109 nt (IAV) or 153 nt (IBV) coding for the PB2 protein. Blue hatched region: C-terminal region of PB2 in which silent (non-coding) nucleotide changes were introduced. 3′NC (27 nt for IAV and 23 nt for IBV) and 5′NC (34 nt for IAV and 60 nt for IBV): non-coding regions of the PB2 segment. (B) The IAV-GFP and IBV-mCherry infectious titers were determined by plaque assay and expressed in Plaque Forming Units (PFU) per mL (green and red solid bars, respectively; left axis). The corresponding titers in physical particles were determined by RT-qPCR targeting the M (for IAV) and HA (for IBV) genomic segments, and expressed in copy numbers per mL (green and red hatched bars, respectively, right axis). (C) MDCK cells were infected with IAV-GFP or IBV-mCherry at a MOI of 0.001 PFU/cell and viral titers in the supernatants collected at 24, 48, and 72 h post-infection were determined by plaque assay. The mean ± S.D. of biological duplicates is shown. Two-way ANOVA test: multiple comparison, Tukey test, α = 0.05, n.s, not significant. (D) A549 or MDCK cells were infected with IAV-GFP or IBV-mCherry at a MOI of 3 PFU/cell and the cell lysates prepared at 3, 6, or 9 h post-infection (hpi) were analyzed by Western-blotting using an antibody targeting the nucleoprotein of IAV (NPA) or IBV (NPB), in parallel with an antibody targeting the GAPDH. NI: not infected.
FIGURE 2
FIGURE 2
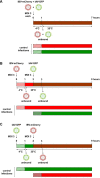
Experimental setup for heterotypic co-infections between IAV and IBV. (A) For simultaneous co-infections, A549 cells were infected with a mixture of IAV-GFP and IBV-mCherry using a MOI of 3 for each virus. After 1 h of adsorption at 4°C, unbound viruses were removed by washing and cells were further incubated for 6 h at 35°C. For sequential co-infections, IBV-mCherry (B) or IAV-GFP (C) were first added on A549 at a MOI of 3 for 1 h at 4°C, unbound viruses were removed by washing and cells were incubated for 1 h at 35°C to allow virus entry. At 1 hpi, cells were infected at a MOI of 3 with IAV-GFP (B) or IBV-mCherry (C). After 1 h of adsorption at 35°C, unbound viruses were removed by washing and cells were further incubated for 6 h at 35°C. Cells were then fixed and the fluorescence was measured by flow cytometry. In parallel, control infections were performed where one of the co-infecting viruses was omitted (either the first or the second one). Green and red hatched bars: IAV-GFP + IBV-mCherry; green hatched or solid bars: IAV-GFP; red hatched or solid bars: IBV-mCherry; hatched bars on white background: incubation at 4°C; hatched bars on gray or colored background and solid bars: incubation at 35°C. For IBV-mCherry, the indicated MOI refers to the stock presented in Figure 1 (MOI of 3 PFU/cell, corresponding to ∼ 5 × 10³ physical particles/cell). For other stocks of IBV-mCherry, an amount of ∼5 × 10³ physical particles/cell was used to obtain between 20 and 60% of mCherry-positive cells at 6 h post-infection.
FIGURE 3
FIGURE 3
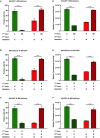
Effect of heterotypic co-infections between IAV and IBV. A549 cells were co-infected, either simultaneously (A,D) or sequentially (B,E,C,F), with IAV-GFP and IBV-mCherry at a MOI of 3 PFU/cell for each virus and analyzed 6 h after the addition of the last virus using flow cytometry. (A–C) The solid bars represent the proportion of fluorescent cells expressing GFP (in green) or mCherry (in red) upon control infection with IAV-GFP or IBV-mCherry alone. The hatched bars represent the proportion of fluorescent cells expressing GFP (in green) or mCherry (in red) upon co-infections. (D–F) The corresponding median fluorescence intensities are shown. (A,D) Simultaneous co-infection with IAV-GFP and IBV-mCherry viruses. (B,E) Primary infection with IBV-mCherry followed 1 hpi with IAV-GFP infection. (C,F) Primary infection with IAV-GFP followed 1 hpi with IBV-mCherry infection. One experiment representative of three independent experiments performed in triplicate is shown (see Supplementary Figure S1). The mean ± S.D. of biological triplicates is shown. Two-way ANOVA test: multiple comparison, Dunn-Sidak test, α = 0.05; ****: adjusted p ≤ 0.0001.
FIGURE 4
FIGURE 4
Effect of heterotypic co-infections using different strains of IAV. (A) A549 cells were infected with IAV strains A/WSN/33, A/PR/8/34 or A/Bretagne/7608/2009 for 1 h and then infected with IBV-mCherry for 6 h. Infected cells were labeled for the NP protein from IAV and analyzed by flow-cytometry for NPA or mCherry expression. The solid bars represent the proportion of fluorescent cells expressing NPA (in green) or mCherry (in red) upon control infections with one of the indicated IAV strains or IBV-mCherry alone, respectively. The hatched bars represent the proportion of fluorescent cells expressing NPA (in green) or mCherry (in red) upon co-infections. One experiment representative of three independent experiments performed in monoplicate is shown (see Supplementary Figures S2A,B). (B) A549 cells were infected for 1 h with A/WSN/33 and then infected with B/Brisbane/60/2008 for 6 h. Infected cells labeled for the NP protein of IBV were detected by flow cytometry. The solid bars represent the mean or median fluorescence intensity upon control infection with B/Brisbane/60/2008 alone. The hatched bars represent the mean or median fluorescence intensity upon co-infection with A/WSN/33 and B/Brisbane/60/2008. One experiment representative of two independent experiments performed in monoplicate is shown (see Supplementary Figure S2C). a.u., arbitrary units.
FIGURE 5
FIGURE 5
Effect of UV-inactivated IAV on IBV infection. A549 cells were infected for 1 h with IAV-GFP or an UV-inactivated IAV-GFP (IAV-GFP-UV) and then with IBV-mCherry for 6 h and analyzed by flow cytometry. The solid bar represents the proportion of mCherry-positive fluorescent cells upon control infection with IBV-mCherry alone. The hatched bar represents the proportion of mCherry-positive cells upon co-infections. The squared bar represents the proportion of mCherry-positive cells upon co-infection with IAV-GFP-UV and IBV-mCherry. One experiment representative of two independent experiments performed in triplicate is shown (see Supplementary Figure S3). The mean ± S.D. of biological triplicate is shown. Two-way ANOVA test: multiple comparison, Dunn-Sidak test, α = 0.05; ns, not significant; ****: adjusted p ≤ 0.0001.
FIGURE 6
FIGURE 6
Effect of IAV-specific antiviral compounds on heterotypic co-infections. A549 cells were infected with IAV-GFP for 1 h and then with an IBV-mCherry virus from two different stocks (A,B) in the presence or absence of the antiviral compounds nucleozin (1 μM, NZ) or pimodivir (50 nM, PI). At 6 hpi, cells were analyzed by flow cytometry. The solid bars represent the proportion of fluorescent cells expressing GFP (in green) or mCherry (in red) upon control infection with IAV-GFP or IBV-mCherry alone. The hatched bars represent the proportion of fluorescent cells expressing GFP (in green) or mCherry (in red) upon co-infections. One experiment representative of three independent experiments performed in triplicate is shown (see Supplementary Figure S4). The mean ± S.D. of biological triplicates is shown. Three-way ANOVA test: multiple comparison, Tukey test, α = 0.05; ns, not significant; ****: adjusted p ≤ 0.0001.

Similar articles

Cited by

References

    1. Aoki H., Nishiyama Y., Tsurumi T., Shibata M., Ito Y., Seo H., et al. (1984). Mechanism of interference between influenza A/WSN and B/Kanagawa viruses. J. General Virol. 65 1385–1393. 10.1099/0022-1317-65-8-1385 - DOI - PubMed
    1. Baker S. F., Nogales A., Finch C., Tuffy K. M., Domm W., Perez D. R., et al. (2014). Influenza A and B virus intertypic reassortment through compatible viral packaging signals. J. Virol. 88 10778–10791. 10.1128/JVI.01440-14 - DOI - PMC - PubMed
    1. Biquand E., Poirson J., Karim M., Declercq M., Malausse N., Cassonnet P., et al. (2017). Comparative profiling of ubiquitin proteasome system interplay with influenza A virus PB2 polymerase protein recapitulating virus evolution in humans. mSphere 2 00317–00330. 10.1128/mSphere.00330-17 - DOI - PMC - PubMed
    1. Caini S., Kusznierz G., Garate V. V., Wangchuk S., Thapa B., de Paula Júnior F. J., et al. (2019). The epidemiological signature of influenza B virus and its B/Victoria and B/Yamagata lineages in the 21st century. PLoS One 14:e0222381. 10.1371/journal.pone.0222381 - DOI - PMC - PubMed
    1. Clark M. P., Ledeboer M. W., Davies I., Byrn R. A., Jones S. M., Perola E., et al. (2014). Discovery of a novel, first-in-class, orally bioavailable azaindole inhibitor (VX-787) of influenza PB2. J. Med. Chem. 57 6668–6678. 10.1021/jm5007275 - DOI - PubMed

LinkOut - more resources