. 2021 Feb 26:12:638231.
doi: 10.3389/fmicb.2021.638231. eCollection 2021.

Equivolumetric Protocol Generates Library Sizes Proportional to Total Microbial Load in 16S Amplicon Sequencing

Affiliations

Equivolumetric Protocol Generates Library Sizes Proportional to Total Microbial Load in 16S Amplicon Sequencing

Giuliano Netto Flores Cruz et al. Front Microbiol. .

Abstract

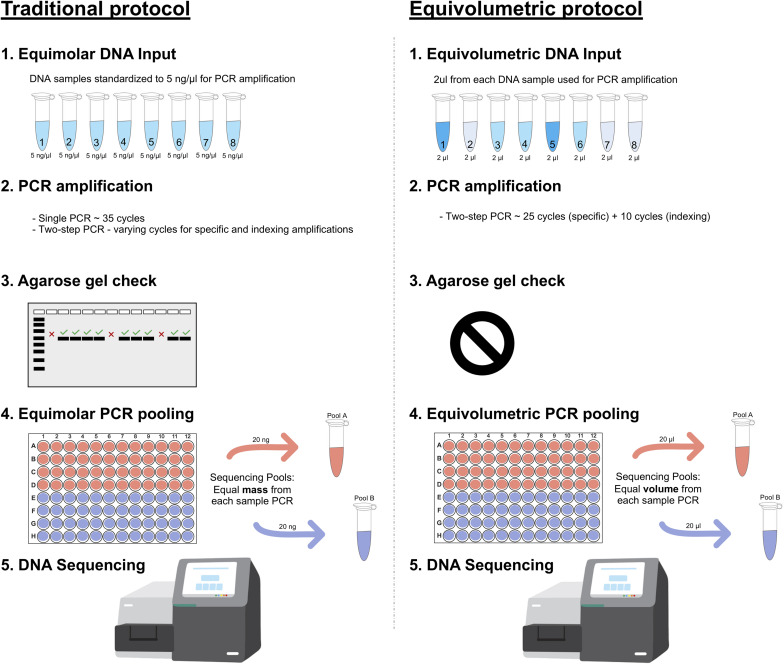
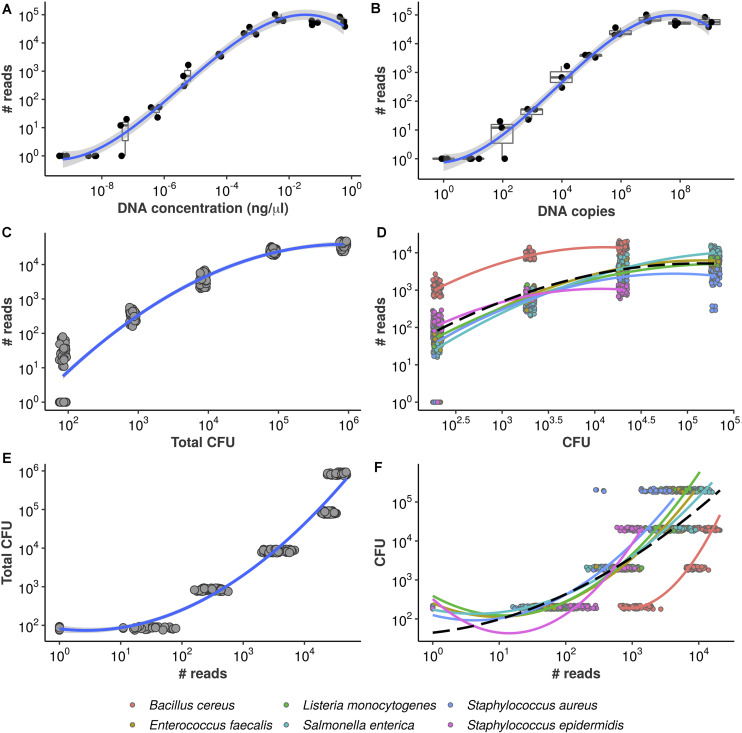
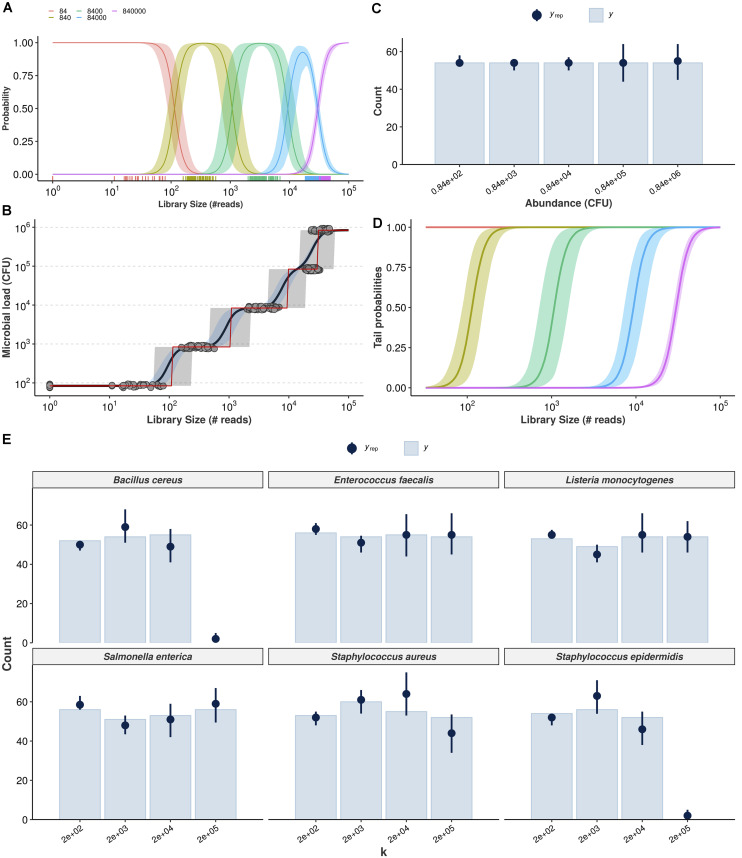
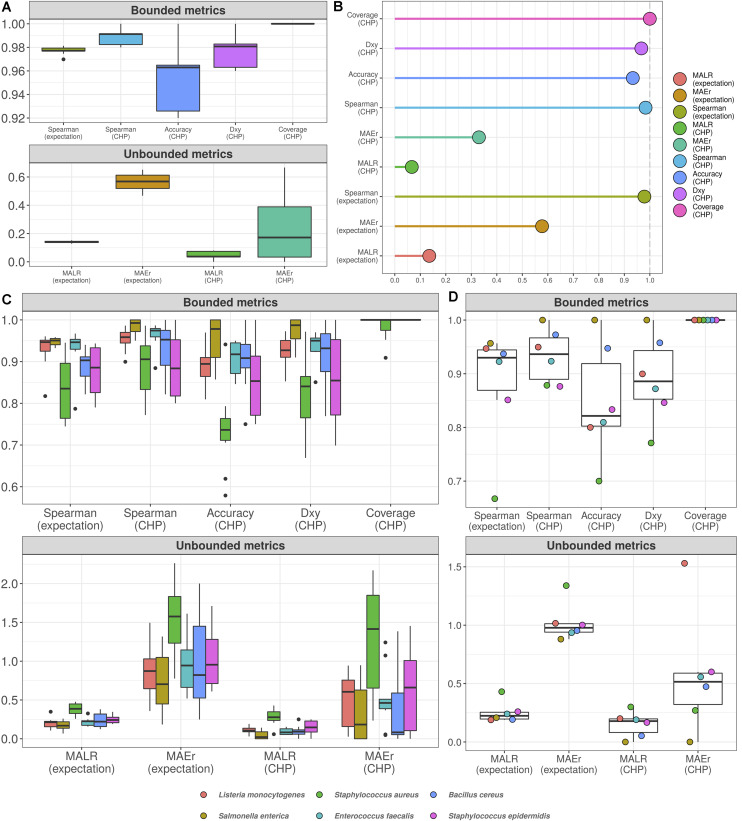
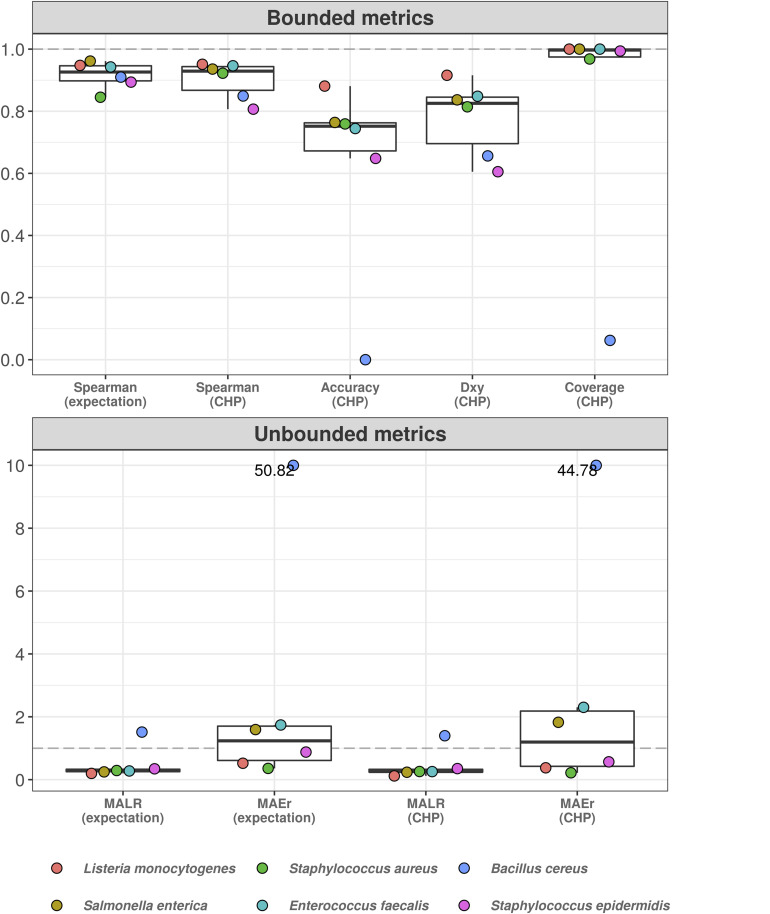
High-throughput sequencing of 16S rRNA amplicon has been extensively employed to perform microbiome characterization worldwide. As a culture-independent methodology, it has allowed high-level profiling of sample bacterial composition directly from samples. However, most studies are limited to information regarding relative bacterial abundances (sample proportions), ignoring scenarios in which sample microbe biomass can vary widely. Here, we use an equivolumetric protocol for 16S rRNA amplicon library preparation capable of generating Illumina sequencing data responsive to input DNA, recovering proportionality between observed read counts and absolute bacterial abundances within each sample. Under specified conditions, we show that the estimation of colony-forming units (CFU), the most common unit of bacterial abundance in classical microbiology, is challenged mostly by resolution and taxon-to-taxon variation. We propose Bayesian cumulative probability models to address such issues. Our results indicate that predictive errors vary consistently below one order of magnitude for total microbial load and abundance of observed bacteria. We also demonstrate our approach has the potential to generalize to previously unseen bacteria, but predictive performance is hampered by specific taxa of uncommon profile. Finally, it remains clear that high-throughput sequencing data are not inherently restricted to sample proportions only, and such technologies bear the potential to meet the working scales of traditional microbiology.

Keywords: 16S rRNA; Illumina; absolute abundances; amplicon sequencing; bacteria; colony-forming units; microbiome.


Conflict of interest statement

All authors are currently full-time employees of BiomeHub (SC, Brazil), a research and consulting company specialized in microbiome technologies. BiomeHub funded the study design, analysis, and data submission for publication.

Figures

FIGURE 1
FIGURE 1
Amplicon library preparation methods for HTS sequencing. Traditional protocol is represented as the most common equimolar process. (1) Equimolar DNA inputs are prepared based on fluorimetric or spectrophotometric measures, all DNA samples are normalized to equivalent amounts (e.g., 5 ng/μL); (2) PCR amplifications are performed with single or two-step protocols with varying amplification cycles (most commonly 35 cycles); (3) Usually, PCR amplifications are then checked on agarose gel to confirm positive samples and discard negative ones; (4) PCR pooling for HTS sequencing is also performed in an equimolar manner through fluorometric quantification (e.g., pooling 20 ng from each sample). Equivolumetric protocol stands for equal volumes processed for each sample instead of equal concentration. In this protocol, samples retain their original differences in terms of concentrations of input DNA. (1) Equal volumes of each sample is used for PCR steps, regardless of its concentration (e.g., 2 μL); (2) Amplicon library preparation is carried out in a standardized, two-step PCR for 25 cycles using specific marker genes, then additional 10 cycles to add the sequencing adapter and indexes; (3) No agarose gel check is performed for these samples since we assume a wide variation in amplicon yield, related to the sample original DNA input; (4) PCR pooling for HTS sequencing is performed without specific sample normalizations. Equal volumes are used for each amplicon sample to assemble the HTS sequencing pool (e.g., pooling 20 μL from each sample).
FIGURE 2
FIGURE 2
Equivolumetric protocol recovers proportionality between input DNA and HTS reads. Synthetic DNA fragment serially diluted from 0.56 to 0.00000056 ng/μL (A) or from 954,000,000 to 954 DNA copies (B) and its total number of reads obtained by HTS sequencing using the equivolumetric protocol. Total sample reads (library size) from sequencing of serially diluted samples of mock microbial community using the equivolumetric protocol demonstrates that the obtained read counts are proportional to total microbial load (C). Similar relationship is observed between taxon-specific counts and abundances (D). The estimation task of CFU based on HTS reads is illustrated for both total microbial load (E) and taxon-specific abundances (F). Total microbial load ranged from 0.84*102 to 0.84*106 CFU, while taxon abundances ranged from 2*102 to 2*105 CFU. A pseudocount of 1 was added to the read counts to avoid log10(0).
FIGURE 3
FIGURE 3
Cumulative probability models for the estimation of absolute bacterial abundances. Estimation of class probabilities for each observed value of total microbial load (in CFU), conditional on observed library size, is retrieved from the ordinal logistic regression framework (A). Conditional expectations are then derived as weighted average of microbial load values and respective class probabilities (black line, 95% credible intervals in light blue) (B). The class of highest probability (CHP, the most likely outcome given the observed reads) is also shown (red line, 95% predictive intervals in gray). Posterior predictive check shows the Bayesian model captures the overall structure of the observed data for total microbial load (yrep: posterior draws, y: observed data) (C). Tail probabilities, herein defined as the probability of observing at least class ck, conditional of observed library size are an alternative for cases in which CHP- and expectation-based predictions are prohibitively uncertain (D). Hierarchical CPM accounts for differences across bacteria and takes advantage of partial pooling to estimate taxon-specific abundances (E). The resulting posterior predictive check indicates no major signs of misfit.
FIGURE 4
FIGURE 4
Cumulative probability models generate accurate predictions for total microbial load and taxon-specific absolute abundances. Performance measures from 10-fold cross-validation of total microbial load model indicate predictive errors are constrained far below one order of magnitude (A). For visualization, bounded metrics vary between 0 and 1, while unbounded metrics vary in the positive real line. Similar results were observed in the held-out test set (B). 10-fold cross validation for taxon-specific predictions using hierarchical CPM indicates predictive performance varies across bacteria, although still far below one order of magnitude (C). Similar results were observed in the held-out test set (D). Predictions based on class of highest probability are indicated with (CHP) in the x-axis, and expectation-based counterparts are indicated likewise. MALR: mean absolute log-ratio; MAEr: mean absolute error relative to true values; Dxy: Somers’ Delta measure of ordinal association; Coverage: observed coverage of 95% predictive interval.
FIGURE 5
FIGURE 5
Hierarchical cumulative probability model predicts previously unseen bacteria with varying performance. Leave-one-group-out cross-validation was used to estimate predictive performance of hierarchical CPM for previously unseen bacteria. The predictive errors are constrained below one order of magnitude for most bacteria, except for Bacillus cereus–which reached errors of almost two orders of magnitude (lower panel). The dashed gray line indicates a value of 1, representing one order of magnitude in the context of MALR. The model fails to classify abundance values of Bacillus cereus (upper panel), although ordinal association (Dxy) remains above 0.6. Most absolute errors represent no more than two times the observed abundances in a context of logarithmic differences–except for B. cereus and (slightly) E. faecalis using CHP. For visualization, we truncated the y-axis of the lower panel at the value of 10 and indicated higher values with numeric labels.

Similar articles

Cited by

References

    1. Agresti A. (2010a). Wiley Series in Probability and Statistics. Hoboken, NJ: John Wiley & Sons, Inc, 281–314. 10.1002/9780470594001.ch10 - DOI
    1. Agresti A. (2010b). Wiley Series in Probability and Statistics. Hoboken, NJ: John Wiley & Sons, Inc, 44–87. 10.1002/9780470594001.ch3 - DOI
    1. Altschul S. F., Gish W., Miller W., Myers E. W., Lipman D. J. (1990). Basic local alignment search tool. J. Mol. Biol. 215 403–410. 10.1016/S0022-2836(05)80360-2 - DOI - PubMed
    1. Amir A., McDonald D., Navas-Molina J. A., Kopylova E., Morton J. T., Xu Z. Z., et al. (2017). Deblur rapidly resolves single-nucleotide community sequence patterns. mSystems 2:e191–16. 10.1128/mSystems.00191-16 - DOI - PMC - PubMed
    1. Bürkner P. (2017). brms?: an R Package for bayesian multilevel models using stan. J. Stat. Softw. 80:29856. 10.18637/jss.v080.i01 - DOI

LinkOut - more resources