. 2021 Feb 26:12:592447.
doi: 10.3389/fimmu.2021.592447. eCollection 2021.

Peptidomes and Structures Illustrate Two Distinguishing Mechanisms of Alternating the Peptide Plasticity Caused by Swine MHC Class I Micropolymorphism

Affiliations

Peptidomes and Structures Illustrate Two Distinguishing Mechanisms of Alternating the Peptide Plasticity Caused by Swine MHC Class I Micropolymorphism

Xiaohui Wei et al. Front Immunol. .

Abstract

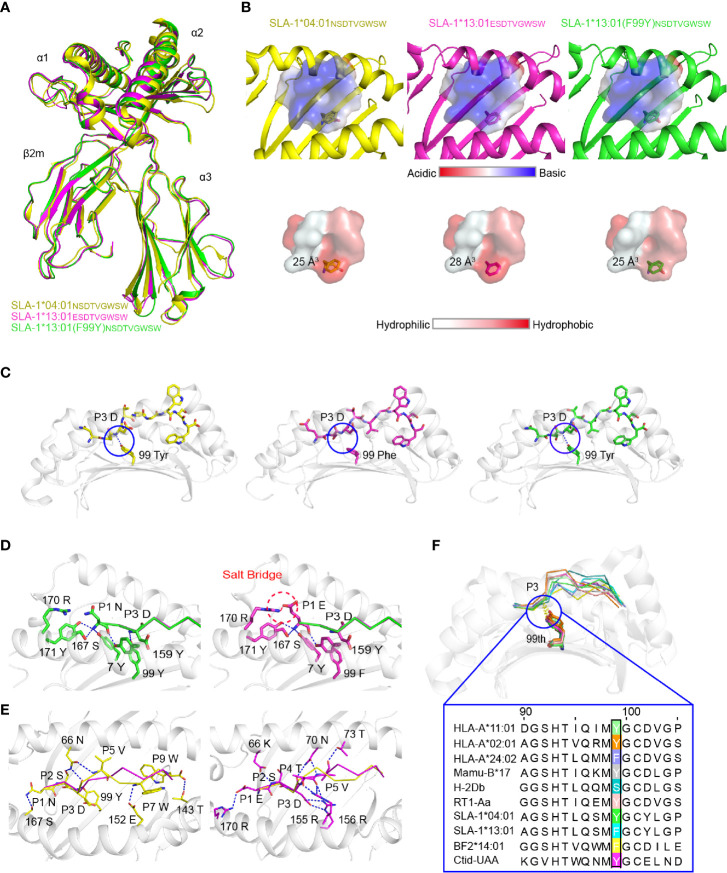
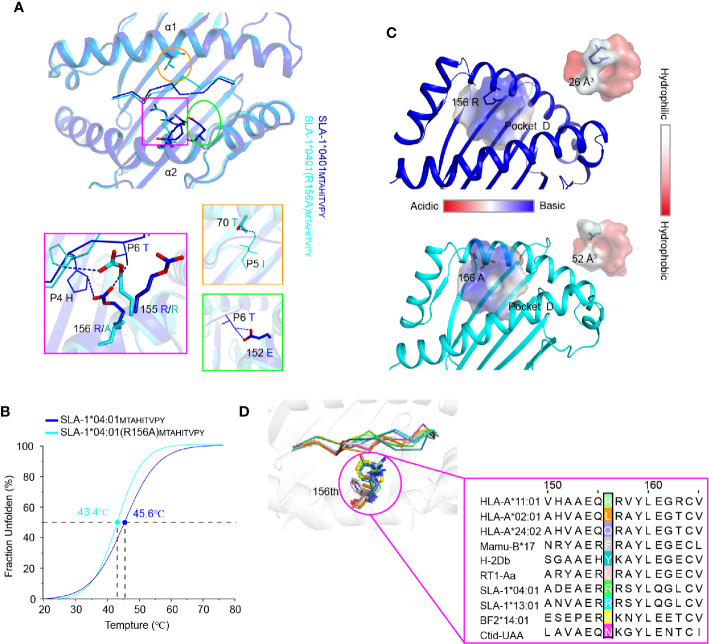
The micropolymorphism of major histocompatibility complex class I (MHC-I) can greatly alter the plasticity of peptide presentation, but elucidating the underlying mechanism remains a challenge. Here we investigated the impact of the micropolymorphism on peptide presentation of swine MHC-I (termed swine leukocyte antigen class I, SLA-I) molecules via immunopeptidomes that were determined by our newly developed random peptide library combined with the mass spectrometry (MS) de novo sequencing method (termed RPLD-MS) and the corresponding crystal structures. The immunopeptidomes of SLA-1*04:01, SLA-1*13:01, and their mutants showed that mutations of residues 156 and 99 could expand and narrow the ranges of peptides presented by SLA-I molecules, respectively. R156A mutation of SLA-1*04:01 altered the charge properties and enlarged the volume size of pocket D, which eliminated the harsh restriction to accommodate the third (P3) anchor residue of the peptide and expanded the peptide binding scope. Compared with 99Tyr of SLA-1*0401, 99Phe of SLA-1*13:01 could not form a conservative hydrogen bond with the backbone of the P3 residues, leading to fewer changes in the pocket properties but a significant decrease in quantitative of immunopeptidomes. This absent force could be compensated by the salt bridge formed by P1-E and 170Arg. These data illustrate two distinguishing manners that show how micropolymorphism alters the peptide-binding plasticity of SLA-I alleles, verifying the sensitivity and accuracy of the RPLD-MS method for determining the peptide binding characteristics of MHC-I in vitro and helping to more accurately predict and identify MHC-I restricted epitopes.

Keywords: RPLD–MS; crystal structure; immunopeptidome; micropolymorphism; swine MHC class I.


Conflict of interest statement

The authors declare that the research was conducted in the absence of any commercial or financial relationships that could be construed as a potential conflict of interest.

Figures

Figure 1
Figure 1
Structure-based alignment and in vitro refolding comparison between SLA-1*04:01 and SLA-1*13:01. (A) Structure-based sequence alignment of SLA-1*04:01 and SLA-1*13:01. Orange arrows above the alignment indicate β-stands; cylinders denote α-helices. Differential residues in pockets are highlighted in different colors; gray residues indicate that they are out of the pockets. (B–D) Mutagenesis and vitro refolding experiments. Gel filtration chromatograms of the refolded products obtained using a Superdex 200 10/300 GL column (GE Healthcare). The black arrows point to the peak of the compound. (B) The gel filtration chromatograms of the in vitro refolding test of SLA-1*04:01 and SLA-1*13:01 with the NW9 peptide. (C) Mutagenesis and in vitro refolding experiment of SLA-1*13:01 with the NW9 peptide. (D) The in vitro refolding experiment of mutant SLA-1*04:01 (Y99F).
Figure 2
Figure 2
Determination of variation-dependent changes in residue 99 between SLA-1*04:01 and SLA-1*13:01. (A) The visual display of SLA-1*04:01, SLA-1*13:01, and its mutant in vitro refolding efficiency with the random nonapeptide repertoire by gel filtration chromatograms. The black arrows point to the peak of the compound. (B) Visual analysis of reliable peptides identified from LC-MS/MS and de novo sequencing by the WebLogo website (http://weblogo.berkeley.edu/). Amino acids are represented by the single-letter code with the height scaled to prevalence and color representing basic (blue), acidic (red), polar (green), and hydrophobic (orange) residues. Only amino acids with a 5% or greater prevalence are depicted. n is the number of peptides within the data set. Each column of amino acids has an error bar at the top. The height of the y-axis is the maximum entropy for the given sequence type (log220 = 4.3 bits). (C) Comparison of motifs between alleles via heatmap analysis from the IceLogo website (https://iomics.ugent.be/icelogoserver/). The color (green or red) indicates a significant difference (P < 0.05) in the amino acid at the position between two allele motifs. (D) Measure of SLA-1*13:01 refolding efficiency with mutated peptide EW9. The black arrows point to the peak of the compound. (E) Thermal stabilities of pSLA-1 complexes analyzed by the CD spectrum. The stabilities can be measured by the Tm value. The Tm values of the complexes are labeled.
Figure 3
Figure 3
Structural analysis of pSLA-1 complexes. (A) The overall structural comparison between pSLA-1*04:01NW9 (yellow), pSLA-1*13:01EW9 (magenta), and pSLA-1*13:01 (F99Y)NW9 (green). The structures are presented in cartoon form. (B) Visualization of the surface charge and hydrophobicity of the ABG. The color indicates different properties according to the caliper at the bottom. The sizes of the pocket space volumes are labeled. (C) The key forces formed by peptides with residue 99 of the pSLA-1 complexes. The hydrogen bonds are indicated by blue dashed lines. (D) The forces between P1 and the pocket A were compared in the structures of SLA-1*13:01EW9 and SLA-1*13:01 (F99Y)NW9. Red dashed lines represent salt bridges formed by P1-Glu with 170Arg. Blue lines show hydrogen bonds between ABG and peptides. (E) Insight into the impact of extra forces on the peptide conformation from SLA-1*04:01NW9 and SLA-1*13:01EW9. (F) Structure-based sequence alignment of residue 99 of representative crystallized MHC class I molecules. The dashed lines indicate conserved hydrogen bonds with the P3 backbone.
Figure 4
Figure 4
The electron density and overall conformation of the structurally defined peptides. Electron densities and overall conformations of peptides from the solved pSLA-1 complexes. Simulated CNS annealing omit maps calculated for the peptides are shown in blue at a contour of 1.0. General side chain orientations and the different interfacing areas of peptides presented in a table, as viewed in profile from the peptide N-terminus toward the C-terminus. Black arrows indicate the directions in which the residues point: up is toward the TCR, down is toward the floor of the ABG, left is toward the α1 helix domain, and right is toward the α2 helix domain. Pockets accommodating each residue are listed under the corresponding anchors within the ABG. ASA, accessible surface area of each residue; BSA, buried surface area of the residues. (A) The presentation of NW9 and EW9 peptides from pSLA-1*04:01NW9, pSLA-1*13:01EW9, and pSLA-1*13:01 (F99Y)NW9. (B) The presentation of the MY9 peptide from pSLA-1*04:01MY9 and pSLA-1*04:01 (R156A)MY9.
Figure 5
Figure 5
Determination of motif changes in SLA-1*04:01 caused by R156A. (A) Visual display of SLA-1*04:01 and its mutant SLA-1*04:01 (R156A) in vitro refolding efficiencies with random nonapeptide repertoire by gel filtration chromatograms. The black arrows point to the peak of the compound. (B) Visual analysis of the identified peptides by the WebLogo website (http://weblogo.berkeley.edu/). Amino acids are represented by their respective single-letter code with their heights scaled to prevalence and colors representing basic (blue), acidic (red), polar (green), and hydrophobic (orange) residues. Only amino acids with a 5% or greater prevalence are depicted. n is the number of peptides within the data set. Each column of amino acids has an error bar at the top. The height of the y-axis is the maximum entropy for the given sequence type (log220 = 4.3 bits). (C) Comparison of motifs between alleles and their mutant via heatmap analysis on the IceLogo website (https://iomics.ugent.be/icelogoserver/). The color (green or red) indicates a significant difference (P < 0.05) in the amino acid at the position between the two allele motifs. (D) Visual display of SLA-1*04:01 and its mutant SLA-1*04:01 (R156A) in vitro refolding efficiencies with peptide NSDTVGWSW by gel filtration chromatograms. The black arrows point to the peak of the compound. (E) Thermal stabilities of pSLA-1*04:01NW9 and pSLA-1*04:01 (R156A)NW9 analyzed by the CD spectrum. The stabilities can be measured by the Tm value. The Tm values of the complexes are labeled.
Figure 6
Figure 6
The structural basis of the residue 156 affecting peptide plasticity. (A) Comparison of the peptide conformation between pSLA-1*04:01MY9 (blue) and pSLA-1*04:01 (R156A)MY9 (cyans). The extra hydrogen bonding forces causing the conformational change are indicated by blue dashed lines. (B) Thermal stabilities of pSLA-1*04:01MY9 and pSLA-1*04:01 (R156A)MY9 analyzed by the CD spectrum. The stabilities can be measured by the Tm value. The Tm values of the complexes are labeled. (C) Character analysis of the D pocket. Residue 156 is shown in ball-and-stick form. D pockets are shown through the surface. The color indicates the surface charge and hydrophobicity, according to the caliper. The sizes of the pocket space volumes are labeled. (D) Structure-based sequence alignment of residue 156 of representative crystallized MHC class I molecules. Residue 156 is shown in ball-and-stick form.
Figure 7
Figure 7
Pattern diagram of micropolymorphism affecting MHC-I peptide presentation. (A) The impacts of mutant 156 on the D pocket properties and peptide binding of MHC-I. The color of a peptide indicates a set of peptides with a specific motif. The change in the pocket properties is represented by different colors. (B) The impacts of variation 99 on the MHC-I D pocket properties and peptide binding.

Similar articles

Cited by

References

    1. Kaufman J. Unfinished Business: Evolution of the MHC and the Adaptive Immune System of Jawed Vertebrates. Annu Rev Immunol (2018) 36:383–409. 10.1146/annurev-immunol-051116-052450 - DOI - PubMed
    1. Illing PT, Pymm P, Croft NP, Hilton HG, Jojic V, Han AS, et al. . HLA-B57 micropolymorphism defines the sequence and conformational breadth of the immunopeptidome. Nat Commun (2018) 9:4693. 10.1038/s41467-018-07109-w - DOI - PMC - PubMed
    1. Garrett TP, Saper MA, Bjorkman PJ, Strominger JL, Wiley DC. Specificity pockets for the side chains of peptide antigens in HLA-Aw68. Nature (1989) 342:692–6. 10.1038/342692a0 - DOI - PubMed
    1. Madden DR. The three-dimensional structure of peptide-MHC complexes. Annu Rev Immunol (1995) 13:587–622. 10.1146/annurev.iy.13.040195.003103 - DOI - PubMed
    1. Reche PA, Reinherz EL. Sequence variability analysis of human class I and class II MHC molecules: functional and structural correlates of amino acid polymorphisms. J Mol Biol (2003) 331:623–41. 10.1016/s0022-2836(03)00750-2 - DOI - PubMed

Publication types

MeSH terms