Comparative Study
. 2021 Feb 25:12:595343.
doi: 10.3389/fimmu.2021.595343. eCollection 2021.

In Nasal Mucosal Secretions, Distinct IFN and IgA Responses Are Found in Severe and Mild SARS-CoV-2 Infection

Affiliations
Comparative Study

In Nasal Mucosal Secretions, Distinct IFN and IgA Responses Are Found in Severe and Mild SARS-CoV-2 Infection

Juliana de Melo Batista Dos Santos et al. Front Immunol. .

Abstract

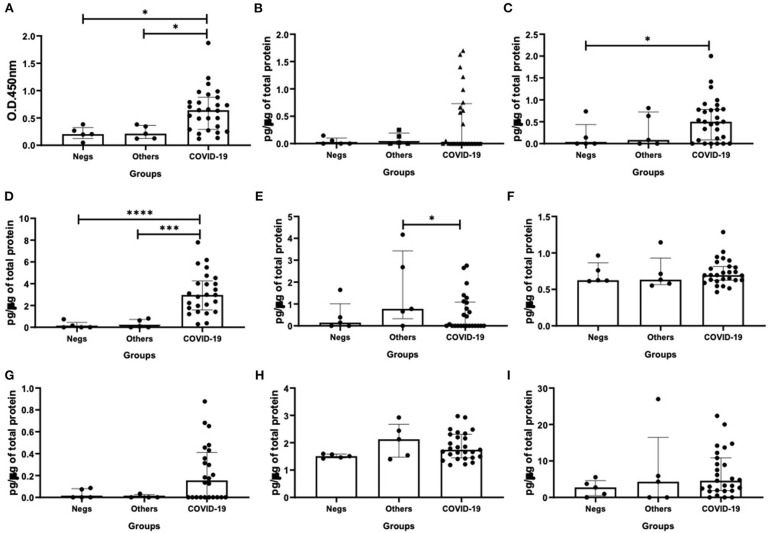
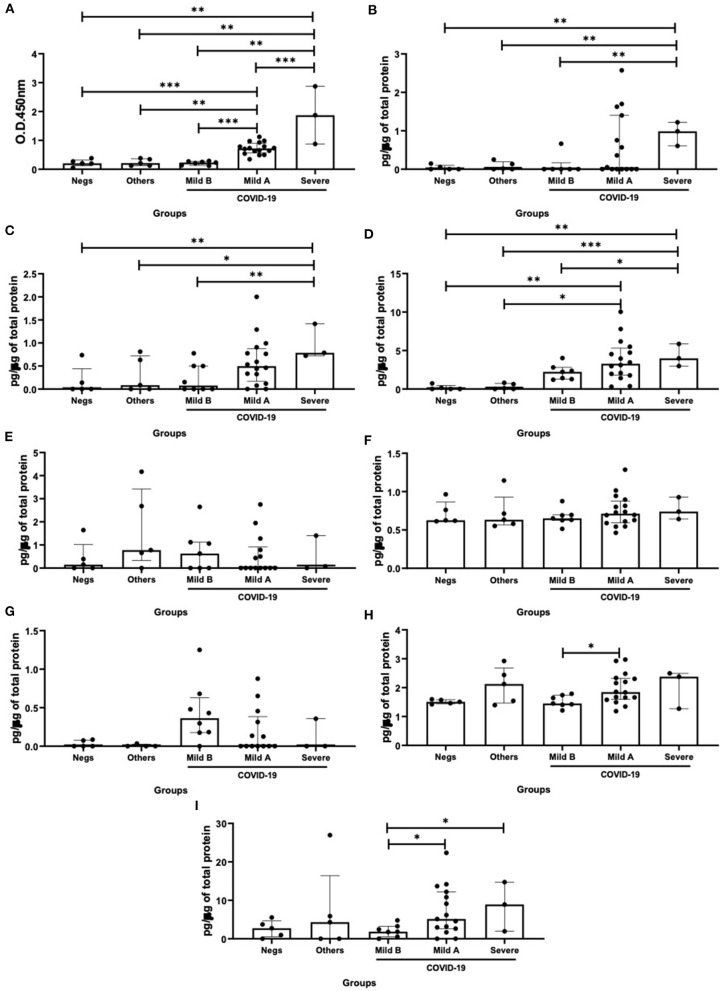
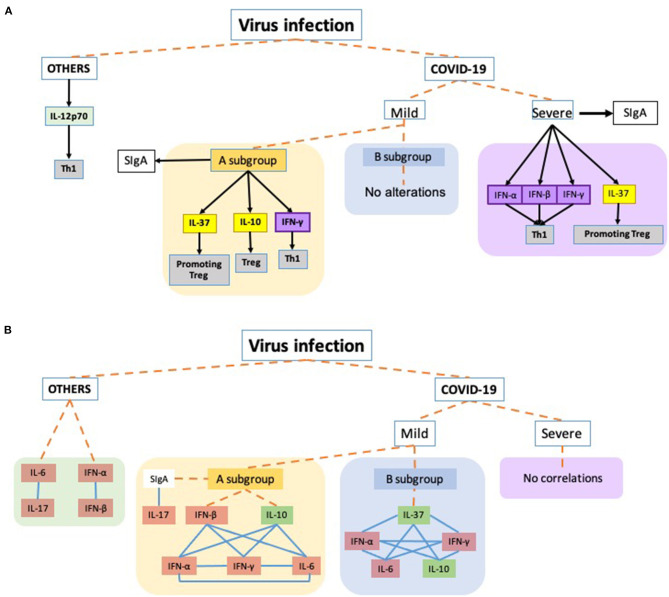
Likely as in other viral respiratory diseases, SARS-CoV-2 elicit a local immune response, which includes production and releasing of both cytokines and secretory immunoglobulin (SIgA). Therefore, in this study, we investigated the levels of specific-SIgA for SARS-CoV-2 and cytokines in the airways mucosa 37 patients who were suspected of COVID-19. According to the RT-PCR results, the patients were separated into three groups: negative for COVID-19 and other viruses (NEGS, n = 5); negative for COVID-19 but positive for the presence of other viruses (OTHERS, n = 5); and the positive for COVID-19 (COVID-19, n = 27). Higher specific-SIgA for SARS-CoV-2, IFN-β, and IFN-γ were found in the COVID-19 group than in the other groups. Increased IL-12p70 levels were observed in OTHERS group as compared to COVID-19 group. When the COVID-19 group was sub stratified according to the illness severity, significant differences and correlations were found for the same parameters described above comparing severe COVID-19 to the mild COVID-19 group and other non-COVID-19 groups. For the first time, significant differences are shown in the airway's mucosa immune responses in different groups of patients with or without respiratory SARS-CoV-2 infection.

Keywords: SARS-CoV-2; cytokine-immunological terms; mucosal immmunity; respiratory; secretory immunoglobulin A; viruses.


Conflict of interest statement

The authors declare that the research was conducted in the absence of any commercial or financial relationships that could be construed as a potential conflict of interest.

Figures

Figure 1
Figure 1
Comparison of the levels of SIgA levels (A), cytokine levels of interferon (IFN)-α (B), IFN-β (C), IFN-γ (D), interleukin (IL)-12p70 (E), IL-6 (F), IL-17 (G), IL-10 (H), and IL-37 (I) between negative, other viruses and COVID-19 groups. Values are presented in median and with respective quartile. Statistical analysis: Kruskal–Wallis with Dunn post hoc test level of significance was established at 5% (*p < 0.05; ***p < 0.001; ****p < 0.0001).
Figure 2
Figure 2
Comparison of the levels of SIgA levels (A), cytokine levels of interferon (IFN)-α (B), IFN-β (C), IFN-γ (D), interleukin (IL)-12p70 (E), IL-6 (F), IL-17 (G), IL-10 (H), and IL-37 (I) between negative, other viruses and mild B, mild A and severe COVID-19 groups. Values are presented in median and with respective quartile. Statistical analysis: Kruskal–Wallis with Dunn post hoc test level of significance was established at 5% (*p < 0.05; **p < 0.01; ***p < 0.001).
Figure 3
Figure 3
Schematic representation of the main findings of this study. Dashed orange lines virus infection to each virus groups: OTHERS (other respiratory viruses, not SARS-Cov2), COVID-19 severity (Mild: mild symptoms and Severe: acute respiratory distress syndrome) and the respective subgroups. COVID-19 Mild A subgroup was composed of patients presenting SIgA levels above the threshold and the Mild B subgroup was composed of mild COVID-19 group presenting SIgA levels below the threshold. (A) Black arrows toward the boxes mean that the cytokines were released by the group/subgroup. The black arrow connecting the severe subgroup to SIgA indicates a higher increase in the antibody levels than observed in the Mild A subgroup which also presented increased levels. Yellow boxes are representing anti-inflammatory cytokines involved in the T regulatory response (Treg), while the purple boxes are representing the interferons, and the gray boxes indicate the t cell profile involved in the corresponding cytokine. (B) Representation of correlations observed in the study. Blue lines connecting the boxes mean that the parameters presented significant positive correlations between them. Orange boxes representing the pro-inflammatory cytokines and the green boxes corresponding to anti-inflammatory cytokines.

Similar articles

Cited by

References

    1. Zhou P, Yang X-L, Wang X-G, Hu B, Zhang L, Zhang W, et al. . A pneumonia outbreak associated with a new coronavirus of probable bat origin. Nature. (2020) 579:270–3. 10.1038/s41586-020-2951-z - DOI - PMC - PubMed
    1. Li W, Moore MJ, Vasilieva N, Sui J, Wong SK, Berne MA, et al. . Angiotensin-converting enzyme 2 is a functional receptor for the SARS coronavirus. Nature. (2003) 426:450–4. 10.1038/nature02145 - DOI - PMC - PubMed
    1. Sungnak W, Huang N, Bécavin C, Berg M, Queen R, Litvinukova M, et al. . SARS-CoV-2 entry factors are highly expressed in nasal epithelial cells together with innate immune genes. Nat Med. (2020) 26:681–7. 10.1038/s41591-020-0868-6 - DOI - PMC - PubMed
    1. Renegar KB, Small PA, Boykins LG, Wright PF. Role of IgA versus IgG in the control of influenza viral infection in the murine respiratory tract. J Immunol. (2004) 173:1978–86. 10.4049/jimmunol.173.3.1978 - DOI - PubMed
    1. Béné MC, de Carvalho M, Eveillard M, Lebri Y. Good IgA bad IgG in SARS-CoV-2 infection? Clin Infect Dis. (2020) 71:897–8. 10.1093/cid/ciaa426 - DOI - PMC - PubMed

Publication types