. 2021 Feb 25:12:598671.
doi: 10.3389/fimmu.2021.598671. eCollection 2021.

Integrative Genomic and Transcriptomic Analyses of Tumor Suppressor Genes and Their Role on Tumor Microenvironment and Immunity in Lung Squamous Cell Carcinoma

Affiliations

Integrative Genomic and Transcriptomic Analyses of Tumor Suppressor Genes and Their Role on Tumor Microenvironment and Immunity in Lung Squamous Cell Carcinoma

Ahreum Kim et al. Front Immunol. .

Abstract

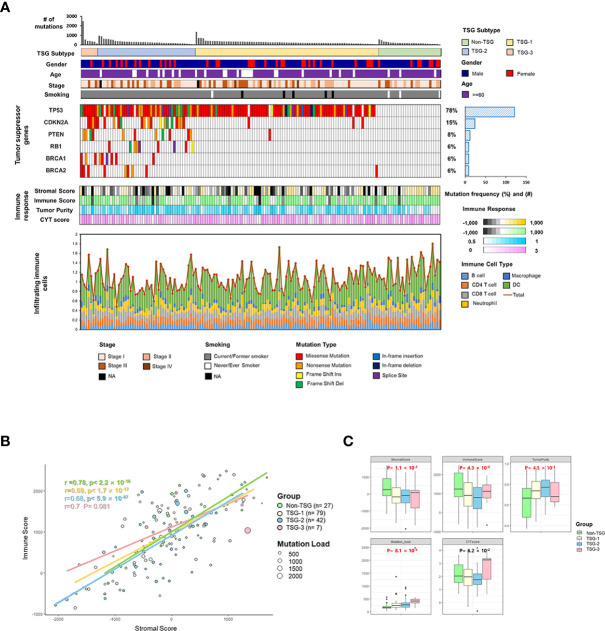
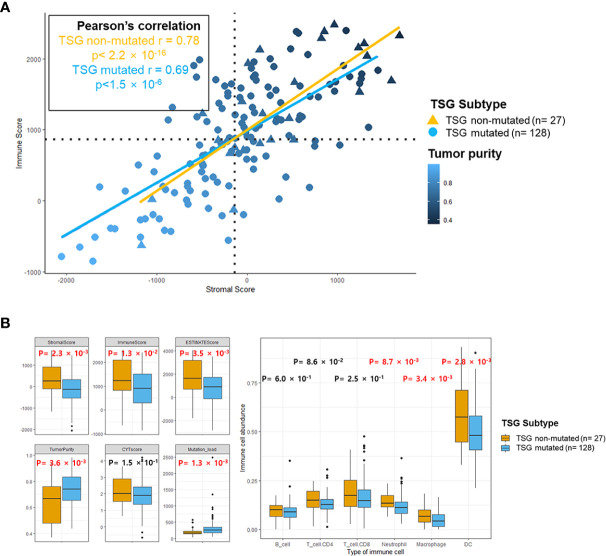
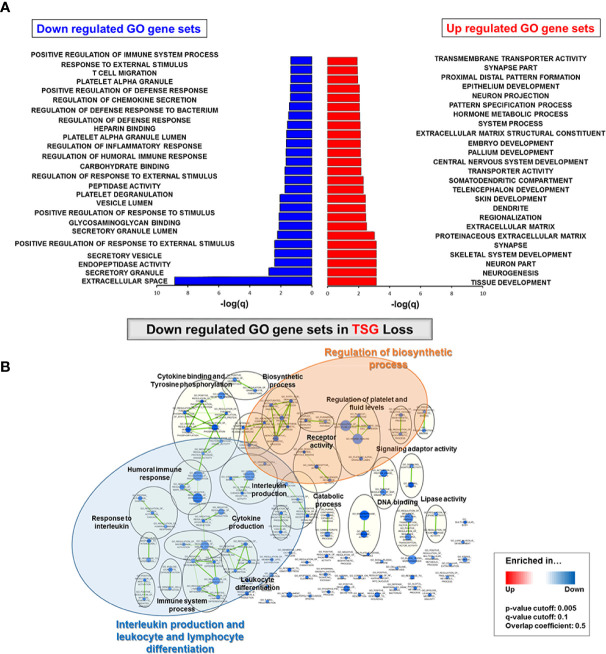
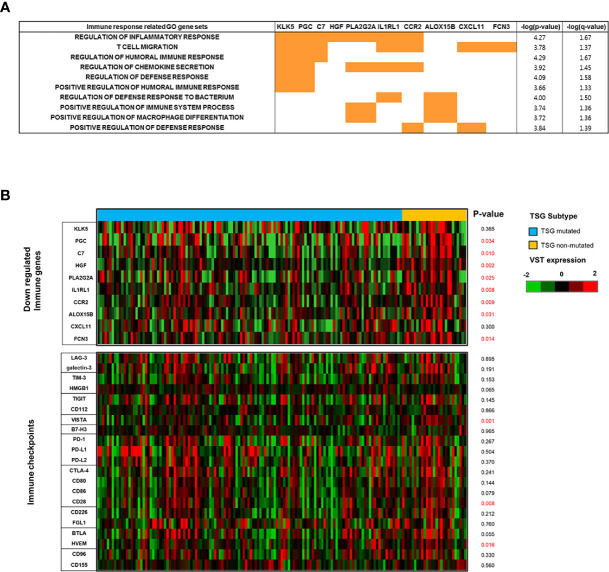
Non-small-cell lung cancers (NSCLCs) are largely classified into lung adenocarcinoma (LUAD) and lung squamous cell carcinoma (LUSC), which have different therapeutic options according to its molecular profiles and immune checkpoint expression, especially PD-L1, which is a suppressive factor in the tumor microenvironment. The tumor microenvironment can be altered by the genomic mutations on specific innate immune genes as well as tumor suppressor genes, so it is essential to comprehend the association between tumor microenvironment and tumor suppressor genes to discover the promising immunotherapeutic strategy to overcome the resistance of immune check point blockade. In this study, we aimed to analyze how the somatic mutations in tumor suppressor genes affect the tumor immune microenvironment through a comprehensive analysis of mutational profiling on the representative tumor suppressor genes (TP53, CDKN2A, PTEN, RB1, BRCA1, BRCA2) and immune gene expression in The Cancer Genome Atlas (TCGA) 155 lung squamous cell carcinoma (LUSC) and 196 lung adenocarcinoma (LUAD) samples. Several microenvironmental factors, such as the infiltrating immune and stromal cells, were suppressed by the mutated tumor suppressor genes in LUSC, unlike in the LUAD samples. In particular, infiltrating immune cells such as macrophage, neutrophil, and dendritic cells were significantly reduced in tumors with mutated tumor suppressor genes' group. In addition, the gene expressions for interleukin production and lymphocyte differentiation and PGC, C7, HGF, PLA2G2A, IL1RL1, CCR2, ALOX15B, CXCL11, FCN3 were significantly down-regulated, which were key immune genes for the cross-talk between LUSC microenvironment and tumor suppressors. Therefore, we generated evidence that TSG mutations in LUSC have an impact on tumor immune microenvironment, which suggests that TSG non-mutated patients will have the more inflamed tumors and are more likely to respond to immune checkpoint blockade therapy.

Keywords: The Cancer Genome Atlas; lung adenocarcinoma; lung squamous cell carcinoma; tumor microenvironment; tumor suppressor gene.


Conflict of interest statement

J-SS was employed by the company Macrogen Inc. The remaining authors declare that the research was conducted in the absence of any commercial or financial relationships that could be construed as a potentialconflict of interest. The authors declare that this study received funding from Macrogen Inc. The funder had the following involvement in the study: the study design, the server for data processing, and the publication fee.

Figures

Figure 1
Figure 1
Identification of TSG subtypes in TCGA LUSC (n = 155). (A) The distribution of somatic nonsynonymous mutations (missense, nonsense, frame shift insertion, frame shift deletion, In-frame insertion, In-frame deletion, and splice site mutation) and TSG subtypes according to the number of mutations in TSGs were described across 155 TCGA LUSC samples, and the mutations on tumor suppressor genes were categorized with the mutation types and frequency. The four different indicators for the immune response (stromal and immune score, tumor purity, and cytolytic score) and infiltrating immune cells (B cells, CD4+ T cells, CD8+ T cells, neutrophil, macrophages, and dendritic cells) across the samples were displayed in each column. (B) The correlation between immune score and stromal score along with the mutation burden was plotted in each of the four TSG subtypes with Pearson’s correlation coefficient. (C) The immune factors (immune and stromal scores, tumor purity, mutation load, and cytolytic score) were box-plotted in four TSG subtypes. Each p-value was indicated by each of the subtypes (Kruskal–Wallis or one-way ANOVA test).
Figure 2
Figure 2
The immune landscape of the microenvironment in TSG subtypes. (A) Scatterplots between stromal and immune scores with tumor purity gradient were shown, and its correlation coefficient was indicated by each of the subtypes. The color grading corresponds to the tumor purity, indexed as shown on the color bar at the bottom right of the panel. The median scores for stromal and immune scores were indicated by dashed lines under the horizontal (x) and vertical (y) axis. (B) Several indicators for immune response and abundance of infiltrating B cells, CD4+ T cells, CD8+ T cells, neutrophil, macrophages, and dendritic cells in two subtypes were estimated, and each p-value was indicated by each of the subtypes (Mann–Whitney U test and unpaired t-test). Box represents the median (thick line) and the quartiles (line).
Figure 3
Figure 3
Gene enrichment analysis in TSG subtypes. (A) Top 25 GO gene sets in either down- and up-regulated GO gene sets were determined based on the rank of enrichment –log10(q value) of the pathway and the matched significance criteria (P-value < 0.05 and FDR q value < 0.1) (B) Network visualization based on gene enrichment analysis. Blue nodes represent the down-regulated gene sets in TSG subtype. Genes in significant networks were annotated and grouped with simplified GO terms. Networks meeting the cut-off conditions detailed at the bottom of the figure (right) were visualized with the Enrichment Map plugin for Cytoscape (P ≤ 0.05, FDR q value ≤ 0.01, and similarity ≤ 0.5).
Figure 4
Figure 4
Impacts of mutated TSGs on immune response in LUSC. (A) The down-regulated immune genes in TSG subtype were classified by each enriched GO immune gene sets and indicated with the p and q values. (B) The expression of the selected immune genes was depicted in the heatmap with the computed p-value between TSG subtypes. The expression of immune checkpoint genes was analyzed and indicated with the p-value between TSG subtypes. All p-values were computed by Mann–Whitney U test or unpaired t-test based on the sample distribution.

Similar articles

Cited by

References

    1. Barta JA, Powell CA, Wisnivesky JP. Global Epidemiology of Lung Cancer. Ann Glob Health (2019) 85(1):8. 10.5334/aogh.2419 - DOI - PMC - PubMed
    1. Schuurman MS, Timmermans M, van Gorp T, de Vijver KKV, Kruitwagen R, Lemmens V, et al. . Trends in incidence, treatment and survival of borderline ovarian tumors in the Netherlands: a nationwide analysis. Acta Oncol (2019) 58(7):983–9. 10.1080/0284186X.2019.1619935 - DOI - PubMed
    1. Lucchetta M, da Piedade I, Mounir M, Vabistsevits M, Terkelsen T, Papaleo E. Distinct signatures of lung cancer types: aberrant mucin O-glycosylation and compromised immune response. BMC Cancer (2019) 19(1):824. 10.1186/s12885-019-5965-x - DOI - PMC - PubMed
    1. Darji K, Frisch S, Adjei Boakye E, Siegfried E. Characterization of children with recurrent eczema herpeticum and response to treatment with interferon-gamma. Pediatr Dermatol (2017) 34(6):686–9. 10.1111/pde.13301 - DOI - PubMed
    1. Rabe KF. Lung cancer staging: a true story. Lancet Respir Med (2015) 3(4):258–9. 10.1016/S2213-2600(15)00030-2 - DOI - PubMed

Publication types

MeSH terms

Substances