. 2021 Feb 24:12:628168.
doi: 10.3389/fimmu.2021.628168. eCollection 2021.

NLRP3 Deficiency Protects Against Intermittent Hypoxia-Induced Neuroinflammation and Mitochondrial ROS by Promoting the PINK1-Parkin Pathway of Mitophagy in a Murine Model of Sleep Apnea

Affiliations

NLRP3 Deficiency Protects Against Intermittent Hypoxia-Induced Neuroinflammation and Mitochondrial ROS by Promoting the PINK1-Parkin Pathway of Mitophagy in a Murine Model of Sleep Apnea

Xu Wu et al. Front Immunol. .

Abstract

Obstructive sleep apnea (OSA) associated neurocognitive impairment is mainly caused by chronic intermittent hypoxia (CIH)-triggered neuroinflammation and oxidative stress. Previous study has demonstrated that mitochondrial reactive oxygen species (mtROS) was pivotal for hypoxia-related tissue injury. As a cytosolic multiprotein complex that participates in various inflammatory and neurodegenerative diseases, NLRP3 inflammasome could be activated by mtROS and thereby affected by the mitochondria-selective autophagy. However, the role of NLRP3 and possible mitophagy mechanism in CIH-elicited neuroinflammation remain to be elucidated. Compared with wild-type mice, NLRP3 deficiency protected them from CIH-induced neuronal damage, as indicated by the restoration of fear-conditioning test results and amelioration of neuron apoptosis. In addition, NLRP3 knockout mice displayed the mitigated microglia activation that elicited by CIH, concomitantly with elimination of damaged mitochondria and reduction of oxidative stress levels (malondialdehyde and superoxide dismutase). Elevated LC3 and beclin1 expressions were remarkably observed in CIH group. In vitro experiments, intermittent hypoxia (IH) significantly facilitated mitophagy induction and NLRP3 inflammasome activation in microglial (BV2) cells. Moreover, IH enhanced the accumulation of damaged mitochondria, increased mitochondrial depolarization and augmented mtROS release. Consistently, NLRP3 deletion elicited a protective phenotype against IH through enhancement of Parkin-mediated mitophagy. Furthermore, Parkin deletion or pretreated with 3MA (autophagy inhibitor) exacerbated these detrimental actions of IH, which was accompanied with NLRP3 inflammasome activation. These results revealed NLRP3 deficiency acted as a protective promotor through enhancing Parkin-depended mitophagy in CIH-induced neuroinflammation. Thus, NLRP3 gene knockout or pharmacological blockage could be as a potential therapeutic strategy for OSA-associated neurocognitive impairment.

Keywords: neuroinflammation; nucleotide‐binding domain like receptor protein 3 (NLRP3); obstructive sleep apnea (OSA); parkin-mediated mitophagy; reactive oxygen species (ROS).


Conflict of interest statement

The authors declare that the research was conducted in the absence of any commercial or financial relationships that could be construed as a potential conflict of interest.

Figures

Figure 1
Figure 1
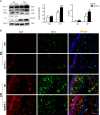
Protective effect of NLRP3 deficiency on CIH-induced neuronal damage in vivo. (A) Effects of NLRP3 deficiency on fear-conditioning tests results. #P < 0.01 versus NA group; *P < 0.05 versus CIH + WT group (n = 6 mice/group). (B) Representative photographs of immunostaining for ASC in hippocampus (×200 magnification). (C) Protein expressions of NLRP3 and cleaved caspase‐1 in hippocampus tissues of NLRP3−/− mice and WT mice measured by western blot. (D) Expression levels of IL-1β mRNA in the hippocampi from WT or NLRP3-/- mice, exposing to NA or CIH. #P < 0.01 versus NA group; **P < 0.01 versus CIH + WT group. (E, F) The neuronal apoptosis was assayed with TUNEL. Typical immunofluorescent micrographs for TUNEL (red) staining from hippocampus tissues of each group. Scale bar = 100 μm. Quantitative analyses of the number of TUNEL-positive cells. #P < 0.01 versus NA group; **P < 0.01 versus CIH + WT group. All data are presented as means ± SEM. CIH, chronic intermittent hypoxia; NA, normal air; WT, wild type.
Figure 2
Figure 2
NLRP3 deficiency prevents CIH-induced microglia activation and oxidative stress in hippocampus. (A) Microglia were detected with ionized calcium binding adapter molecule 1 (Iba1) antibody. Photomicrographs showed the Iba‐1 (green) immunofluorescent staining from hippocampus and cortex tissues of each group. Note that Iba‐1 was highly expressed in response to CIH. Scale bar = 50 μm. (B) Bar graphs displayed the percentage of Iba-1 positive cells per high-power field (n = 6). The hippocampal MDA content (C), SOD activities (D), and mitochondrial ROS levels (E) were measured in tissue homogenates (n = 6 per group). The data are presented as means ± SEM. #P < 0.01 versus NA group; *P < 0.05 and **P < 0.01 versus CIH + WT group. CIH, chronic intermittent hypoxia; NA, normal air; WT, wild type; MDA, malondialdehyde; SOD, superoxide dismutase.
Figure 3
Figure 3
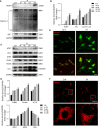
NLRP3 deficiency enhances CIH-induced mitophagy and increases parkin expression in vivo. (A) Protein expressions of Beclin-1, Parkin, TOM20, and LC3 in hippocampal tissues of NLRP3−/− mice and WT mice measured by western blot. Values are expressed as means ± SEM. #P < 0.05 versus NA group; *P < 0.05 and **P < 0.01 versus CIH + WT group. (B) Representative images of double-labeled with LC3 and IBA1 (microglia, white arrow) in hippocampus revealed the increased autophagosome formation after 5 weeks of CIH exposure, especially the NLRP3-/- group. Scale bars = 50 μm. CIH, chronic intermittent hypoxia; NA, normal air; WT, wild type.
Figure 4
Figure 4
IH induces NLRP3 inflammasome activation and Parkin-mediated mitophagy in BV2 cells. (A) Protein levels of NLRP3, cleaved caspase-1 and ASC increased significantly in BV2 cells subjected to 24h of IH, indicating activation of NLRP3 inflammasome. (B) Densitometric quantification of relative protein expression normalized to GAPDH was shown on the bar graphs. (C) Western blot revealed the significant increased levels of autophagic and mitophagic markers (ATG-5, ATG-7, PINK1, Parkin, and LC3-II), and decreased p62 expression in response to IH. (D) Quantification of relative protein expression assessed by densitometric analysis with GAPDH as an internal control. (n = 3 in each group). Values are expressed as means ± SEM. *P < 0.05 versus control group; **P < 0.01 versus control group. (E) Cells were double-labeled with parkin (green) and mitochondrial outer membrane protein TOM20 (red). Immunofluorescence images showed more parkin-positive cells colocalized with TOM20 following IH, suggesting the mitophagy induction. bar = 50 μm. (F) Confocal imaging presented the mitochondrial network stained for the MitoTracker (TOM20), in NA and IH microglial cells. bar = 50 μm. Similar results were obtained from three independent experiments. IH, intermittent hypoxia.
Figure 5
Figure 5
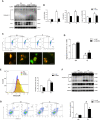
NLRP3 knockout restores the IH from the mitochondrial dysfunction and reduces mtROS production in vitro. (A) Immunoblot protein expressions of NLRP3, ASC and caspase-1 in IH-treated BV2 cells transfected with LV-NLRP3 or LV-NC. (B) The amounts of each protein were quantified by densitometry and expressed relative to the amount of GAPDH in the same samples. (C) LV-NC or LV-NLRP3 transfected BV2 cells were stained with JC-1 and analyzed by flow cytometry (upper) and microscopy (below). Scale bar = 50 μm. (D) Quantification of MMP was represented as the ratio red to green fluorescence. (E) LV-NC or LV-NLRP3 transfected cells were stained with MitoSOX and analyzed by flow cytometry. IH-elicited mtROS generation was inhibited by NLRP3 deficiency. (F) Cell lysates were immunoblotted for apoptotic proteins in BV2 cells. (G) Apoptosis of cells transfected with LV-NLRP3 in the presence or absence of IH was assayed by Annexin-V/PI staining. The quantitative rate of apoptosis was presented on the right histogram. Values are expressed as means ± SEM of three independent experiments. #P < 0.05 versus LV-NC group; *P < 0.05 versus IH + LV-NC group; **P < 0.01 versus IH + LV-NC group. IH, intermittent hypoxia; NA, normal air; LV, lentivirus; mtROS, mitochondrial reactive oxygen species.
Figure 6
Figure 6
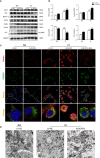
NLRP3 knockout provides protective effect against IH via Parkin-dependent mitophagy in vitro. (A) Representative western blot bands from BV2 cells transfected with LV-NLRP3 or LV-NC showed autophagic and mitophagic protein expression in the presence or absence of IH. (B) Densitometric quantification of PINK1, Parkin, P62, and LC3-II levels in comparison with GAPDH as a loading control. The results of statistical analysis were shown three independent replicates. Values are expressed as means ± SEM. #P < 0.01 versus LV-NC group; *P < 0.05 versus IH + LV-NC group. (C) Representative confocal microscopic images of gene-modified BV2 cells co-localization with Parkin (red) and TOM20 (green). Scale bar = 25 μm. (D) Representative TEM images of mitophagosomes (red arrow) in BV2 cells after IH exposure. Scale bar = 1 μm. IH, intermittent hypoxia; NA, normal air; LV, lentivirus; TEM, transmission electron microscopy.
Figure 7
Figure 7
Parkin knockdown reverses the positive effect of NLRP3 deletion on mitochondrial maintenance in microglia. Gene modified BV2 cells transfected with sh-Parkin or pretreated with 3MA (5 mM) for 6h before exposure to IH. (A) Flow cytometry and immunofluorescent staining reflected the MMP. Scale bar = 50 μm. (B) Quantification of MMP changes was represented as the ratio of red to green fluorescence. (C) Parkin sh-RNA transfected LV-NC or LV-NLRP3 cells were stained with MitoSOX. (D) The quantitative histograms from the obtained results. #P < 0.05 versus LV-NC + shNC group; *P < 0.05 versus IH + LV-NC + shNC group; P < 0.05 versus IH + LV-NC + shNC group. (E) Western blot analysis revealed that Parkin knockdown or pretreated with 3MA exacerbated the apoptosis that caused by IH, and neutralized the positive effect of NLRP3 knockout. (F, G) Effects of Parkin knockdown or 3MA pretreatment on cleaved caspase-1 and ASC protein expressions in gene modified BV2 cells exposed to IH. Representative histograms to quantify the relative levels and GADPH acted as an internal control. Similar results were obtained from three independent experiments. Data are presented as the mean ± SEM. *P < 0.05. NC, negative control; NS, not significant; IH, intermittent hypoxia; NA, normal air.
Figure 8
Figure 8
Parkin knockdown blocks the activation of mitophagy inducing by NLRP3 deletion in IH-treated microglia. (A) Immunoblot showed that after NLRP3 deletion, Parkin knockdown or 3-MA (autophagy inhibitor) pretreatment restrained the autophagy and mitophagy expressions (LC3-II, Beclin-1, ATG-5, ATG-7, Parkin, and PINK1), but upregulated P62 under IH condition in BV2 cells. (B) Quantification of autophagic flux was represented as the ratio of LC3 II to LC3 I proteins levels. Data are indicated as the mean ± SEM (n = 3 in each group). *P < 0.05; **P < 0.01; N.S, not significant. (C) Transfection with sh-Parkin inhibited the co-localization with TOM20 (green) and LC3 (red) upon IH challenge in NLRP3-/- microglia. Scale bar = 25 μm. IH, intermittent hypoxia; NA, normal air; LV, lentivirus.

Similar articles

Cited by

References

    1. Prabhakar NR, Peng YJ, Nanduri J. Hypoxia-inducible factors and obstructive sleep apnea. J Clin Invest (2020) 130:5042–51. 10.1172/JCI137560 - DOI - PMC - PubMed
    1. Wu X, Lu H, Hu L, Gong W, Wang J, Fu C, et al. . Chronic intermittent hypoxia affects endogenous serotonergic inputs and expression of synaptic proteins in rat hypoglossal nucleus. Am J Transl Res (2017) 9:546–57. - PMC - PubMed
    1. Polsek D, Gildeh N, Cash D, Winsky-Sommerer R, Williams S, Turkheimer F, et al. . Obstructive sleep apnoea and Alzheimer’s disease: In search of shared pathomechanisms. Neurosci Biobehav Rev (2018) 86:142–9. 10.1016/j.neubiorev.2017.12.004 - DOI - PMC - PubMed
    1. Gildeh N, Drakatos P, Higgins S, Rosenzweig I, Kent BD. Emerging co-morbidities of obstructive sleep apnea: cognition, kidney disease, and cancer. J Thorac Dis (2016) 8:E901–17. 10.21037/jtd.2016.09.23 - DOI - PMC - PubMed
    1. Mkrtchyan GV, Graf A, Trofimova L, Ksenofontov A, Baratova L, Bunik V. Positive correlation between rat brain glutamate concentrations and mitochondrial 2-oxoglutarate dehydrogenase activity. Anal Biochem (2018) 552:100–9. 10.1016/j.ab.2018.01.003 - DOI - PubMed

Publication types

MeSH terms