. 2021 Feb 25:12:632333.
doi: 10.3389/fimmu.2021.632333. eCollection 2021.

Immunological Feature and Transcriptional Signaling of Ly6C Monocyte Subsets From Transcriptome Analysis in Control and Hyperhomocysteinemic Mice

Affiliations

Immunological Feature and Transcriptional Signaling of Ly6C Monocyte Subsets From Transcriptome Analysis in Control and Hyperhomocysteinemic Mice

Pingping Yang et al. Front Immunol. .

Abstract

Background: Murine monocytes (MC) are classified into Ly6Chigh and Ly6Clow MC. Ly6Chigh MC is the pro-inflammatory subset and the counterpart of human CD14++CD16+ intermediate MC which contributes to systemic and tissue inflammation in various metabolic disorders, including hyperhomocysteinemia (HHcy). This study aims to explore molecule signaling mediating MC subset differentiation in HHcy and control mice.

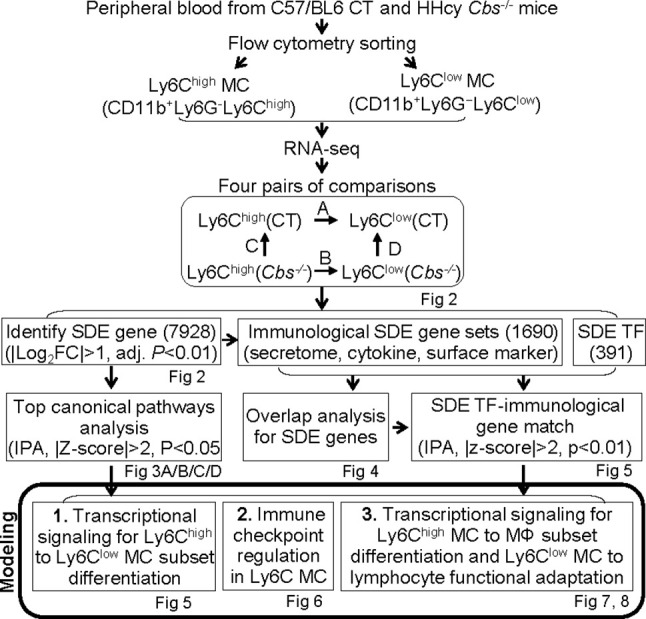
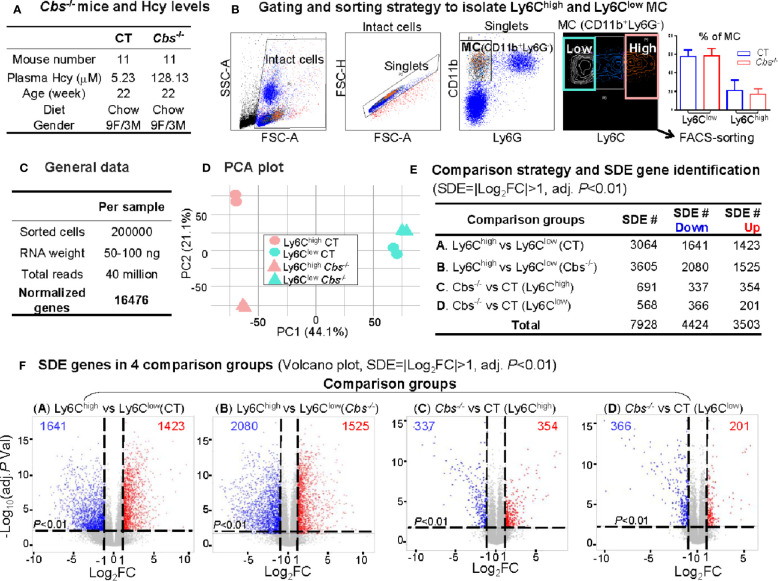
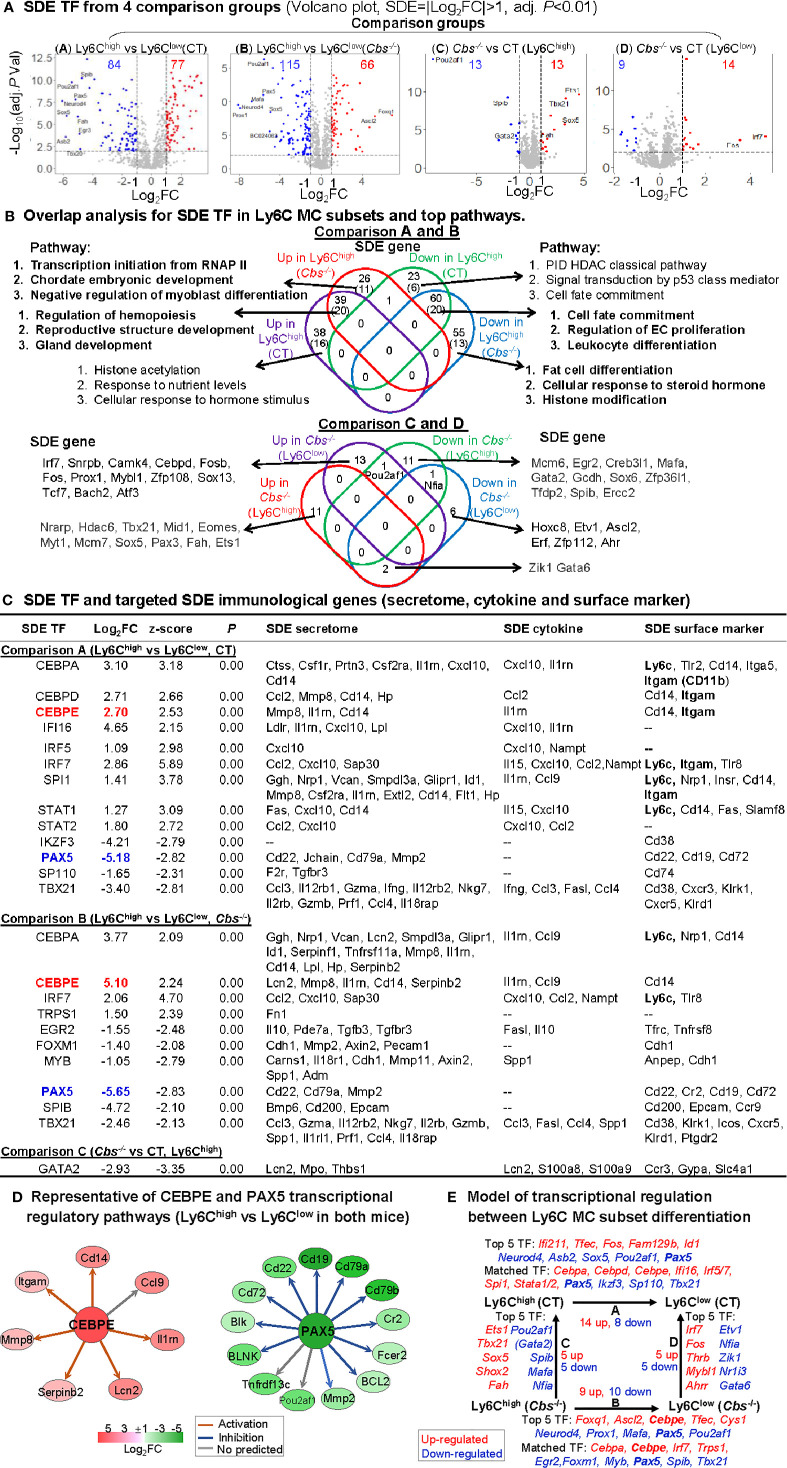
Methods: RNA-seq was performed in blood Ly6Chigh and Ly6Clow MC sorted by flow cytometry from control and HHcy cystathionine β-synthase gene-deficient (Cbs-/-) mice. Transcriptome data were analyzed by comparing Ly6Chigh vs. Ly6Clow in control mice, Ly6Chigh vs. Ly6Clow in Cbs-/- mice, Cbs-/- Ly6Chigh vs. control Ly6Chigh MC and Cbs-/- Ly6Clow vs. control Ly6Clow MC by using intensive bioinformatic strategies. Significantly differentially expressed (SDE) immunological genes and transcription factor (TF) were selected for functional pathways and transcriptional signaling identification.

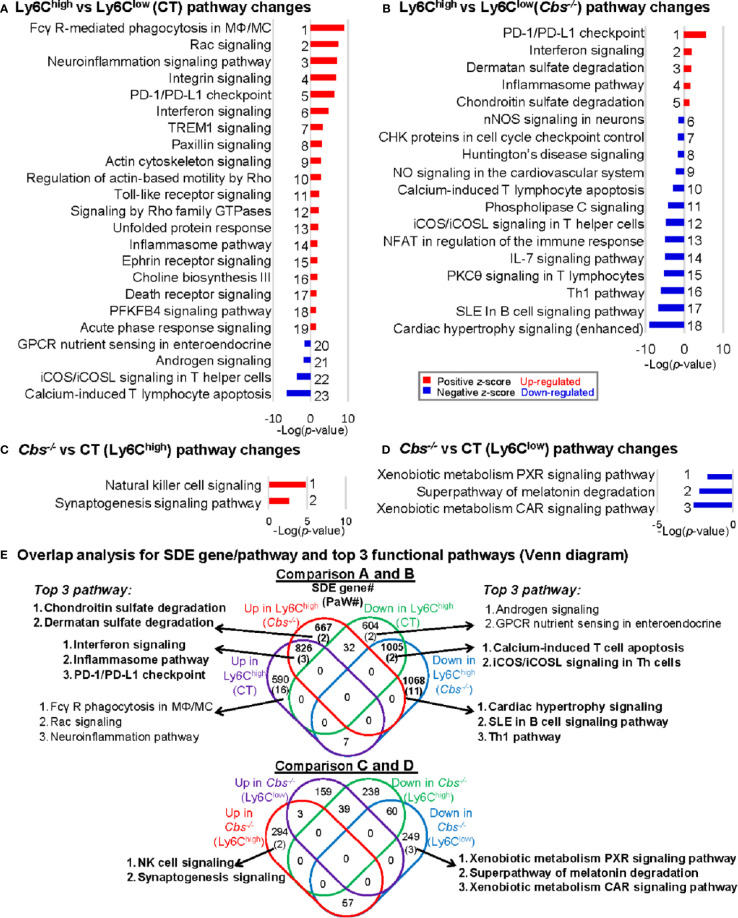
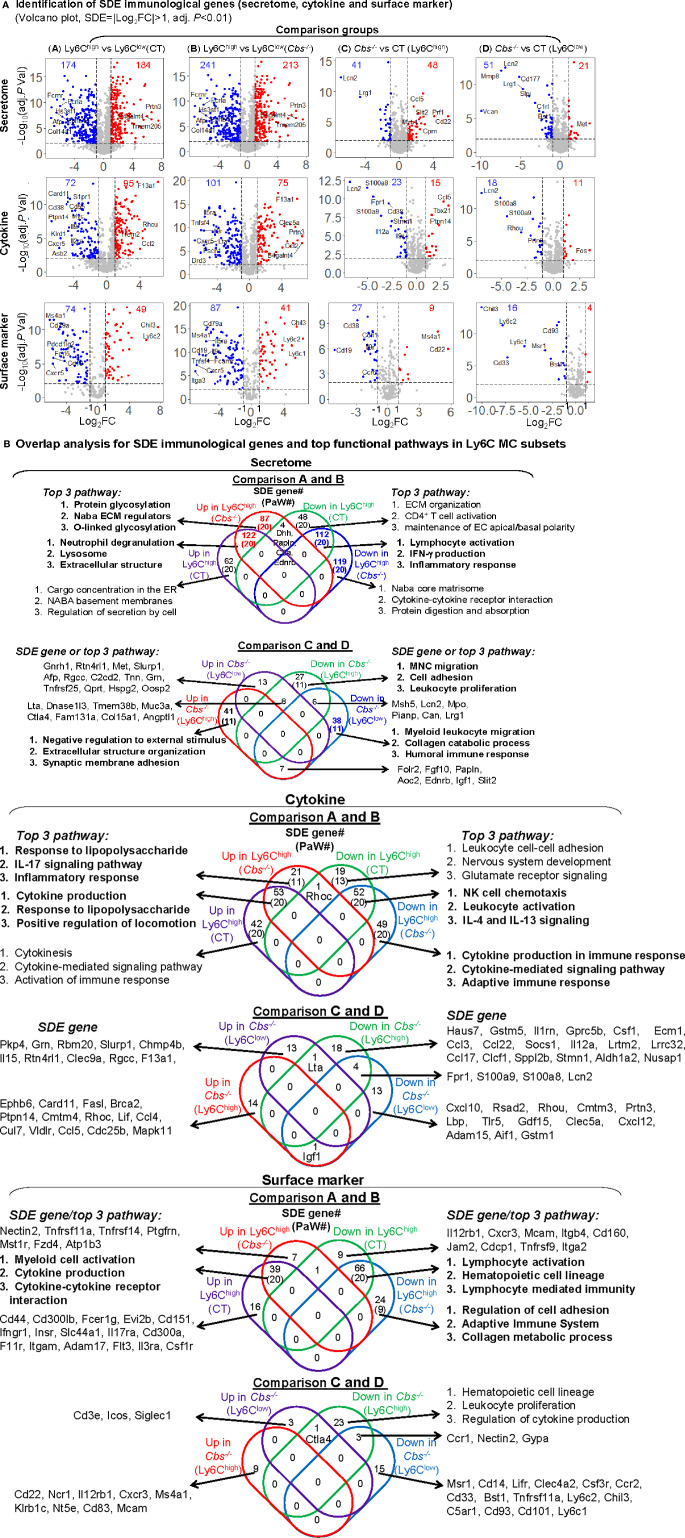
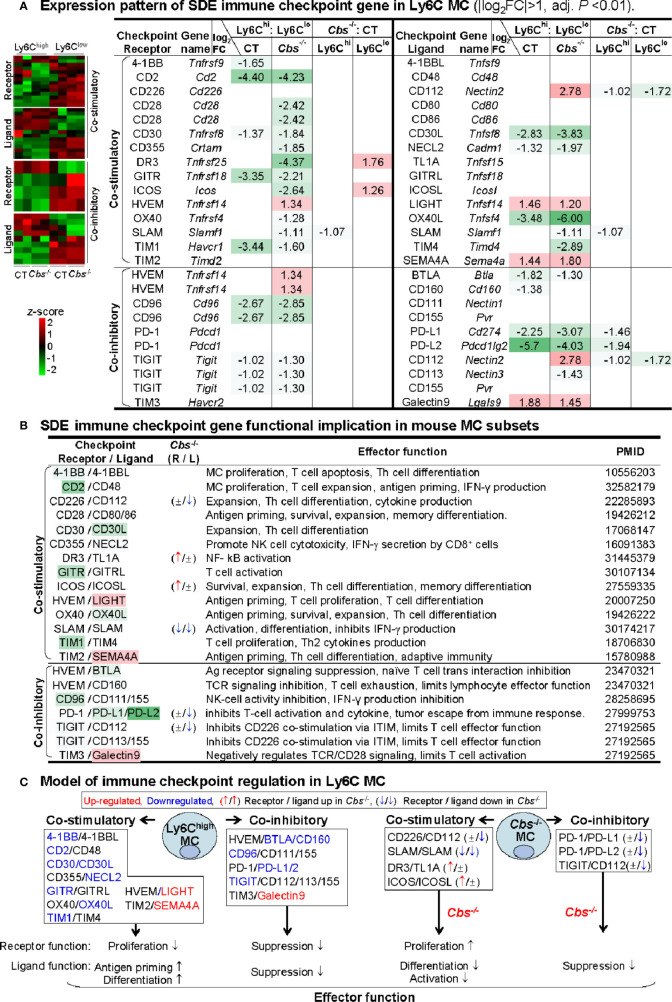
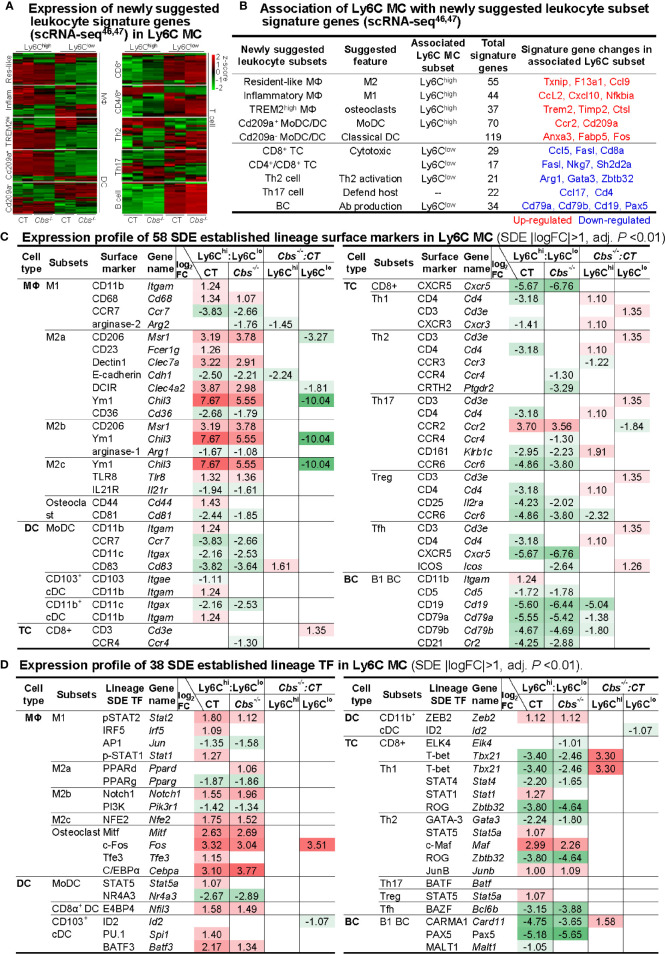
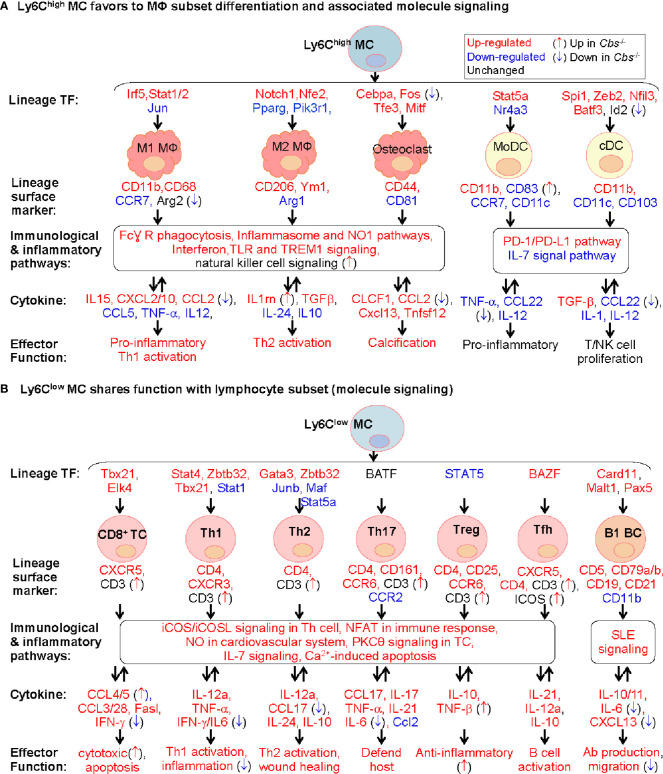
Results: A total of 7,928 SDE genes and 46 canonical pathways derived from it were identified. Ly6Chigh MC exhibited activated neutrophil degranulation, lysosome, cytokine production/receptor interaction and myeloid cell activation pathways, and Ly6Clow MC presented features of lymphocyte immunity pathways in both mice. Twenty-four potential transcriptional regulatory pathways were identified based on SDE TFs matched with their corresponding SDE immunological genes. Ly6Chigh MC presented downregulated co-stimulatory receptors (CD2, GITR, and TIM1) which direct immune cell proliferation, and upregulated co-stimulatory ligands (LIGHT and SEMA4A) which trigger antigen priming and differentiation. Ly6Chigh MC expressed higher levels of macrophage (MΦ) markers, whereas, Ly6Clow MC highly expressed lymphocyte markers in both mice. HHcy in Cbs-/- mice reinforced inflammatory features in Ly6Chigh MC by upregulating inflammatory TFs (Ets1 and Tbx21) and strengthened lymphocytes functional adaptation in Ly6Clow MC by increased expression of CD3, DR3, ICOS, and Fos. Finally, we established 3 groups of transcriptional models to describe Ly6Chigh to Ly6Clow MC subset differentiation, immune checkpoint regulation, Ly6Chigh MC to MΦ subset differentiation and Ly6Clow MC to lymphocyte functional adaptation.

Conclusions: Ly6Chigh MC displayed enriched inflammatory pathways and favored to be differentiated into MΦ. Ly6Clow MC manifested activated T-cell signaling pathways and potentially can adapt the function of lymphocytes. HHcy reinforced inflammatory feature in Ly6Chigh MC and strengthened lymphocytes functional adaptation in Ly6Clow MC.

Keywords: hyperhomocysteinemia; immune checkpoint; immunological gene; locus C (Ly6C) monocyte subset; lymphocyte antigen 6 complex; transcription factor.


Conflict of interest statement

The authors declare that the research was conducted in the absence of any commercial or financial relationships that could be construed as a potential conflict of interest.

Figures

Figure 1
Figure 1
Overall strategy of the identification of Ly6C MC regulatory genes and molecule mechanism for Ly6C monocyte subset differentiation in control and Cbs -/- mice. RNA-seq were performed in Ly6Chigh (CD11b+Ly6GLy6Chigh) and Ly6Clow (CD11b+Ly6GLy6Clow) MC isolated by flow cytometry sorting from peripheral blood of C57/BL6 control and Cbs -/- mice. Transcriptome data were analyzed by performing four pairs of comparisons; (A) Ly6Chigh vs. Ly6Clow (CT), (B) Ly6Chigh vs. Ly6Clow (Cbs-/-), (C) Cbs-/- vs. CT (Ly6Chigh), (D) Cbs-/- vs. CT (Ly6Clow). We identified 7928 SDE genes using the Bioconductor suite of packages in RStudio software with the criteria of |Log2FC| more than 1 (2-FC) and adjusted P value less than 0.01. Top ingenuity pathways were identified by top-down analysis using IPA with |Z-score|>2, P value<0.05. Immunological SDE gene sets, including secretome, cytokine and surface marker were overlapped analysis and matched with corresponding upstream SDE TF by IPA upstream analysis. Three molecular signaling model system were developed, 1) Transcriptional regulation for Ly6Chigh to Ly6Clow MC subset differentiation, 2) Immune checkpoint regulation in Ly6C MC. 3) Transcriptional signaling for Ly6Chigh MC to MΦ subset differentiation and Ly6Clow MC to lymphocyte functional adaptation, CT, control, HHcy, Hyperhomocysteinemia; RNA-seq, RNA-sequencing; MC, monocyte; Cbs, Cystathionine β-synthase; SDE, significant differentially expressed; IPA, Ingenuity Pathway Analysis, TF, transcription factor, MΦ, macrophage.
Figure 2
Figure 2
RNA-Seq analysis and SDE gene identification from blood Ly6Chigh and Ly6Clow MC of C57/BL6 control and Cbs -/- mice. (A) Cbs -/- mice and Hcy levels. Eleven mice were used in each group. Severe HHcy were determined in Cbs -/- mice (plasma Hcy 128.13 μmol/L). (B) Gating and sorting strategy to isolate Ly6Chigh and Ly6Clow MC. Mouse white blood cell were prepared from peripheral blood and stained with antibody against CD11b, Ly6G and Ly6C and subjected for flow cytometry cell sorting. Intact cells (72.8%) were recognized based on higher FSC-A (larger size). Singlets (71.0%) were identified by using FSC-H versus FSC-A appeared on a diagonal. CD11b+Ly6G- cells (11.0%) were selected as MC. MC subsets (CD11b+Ly6G-Ly6Chigh, and CD11b+Ly6G-Ly6Clow) were sorted based on Ly6C levels. The quantification of MC was used flow cytometry analysis for Ly6Chigh and Ly6Clow MC in CT and Cbs-/-. (C) General data. 100 ng mRNA were obtained from 100,000 sorted cells and achieved around 30 million reads and 16,487 normalized genes per sample by mRNA-Seq analysis. (D) PCA plot. PCA analysis incorporated 8 samples from 4 groups of MC subsets {Ly6Chigh (CT), Ly6Clow (CT), Ly6Chigh (Cbs-/-) and Ly6Clow (Cbs-/-), n=2} using the R software package Seurat. PC1 versus PC2 demonstrates the close transcriptional proximity. PC1, PC2 and PC3 variance is 44.1%, 21.1% and 12.9%. PC1 (44.1%) means that the difference on the x-axis can explain 44.1% of the overall result. (E) Comparison strategy and SDE gene identification. We performed four group comparison (A–D) and identified down-regulated and up-regulated SDE genes using the criteria of |Log2FC| more than 1 (2-FC) and adjusted P value less than 0.01. (F) SDE genes in four comparison groups. Volcano plot of all genes demonstrates the expression pattern of SDE genes in four comparison groups. Down-regulated SDE genes are highlighted in green and up-regulated in red (|Log2FC|>1, adj. P<0.01), with Log2FC as x-axis and −Log10(adjust P-value) as y-axis. MC, monocyte; CT, control; Cbs, cystathionine β-synthase; HHcy, Hyperhomocysteinemia; Hcy, homocysteine; FACS, fluorescent-activated cell sorting; PCA, principal component analysis; PC, principal component; SDE, significantly differentially expressed; FC, fold change.
Figure 3
Figure 3
General canonical pathway analysis for SDE genes from four comparison groups. (A) Ly6Chigh vs. Ly6Clow (CT) pathway changes; (B) Ly6Chigh vs. Ly6Clow (Cbs-/-) pathway changes; (C) Cbs-/- vs. CT (Ly6Chigh) pathway changes; (D) Cbs-/- vs. CT (Ly6Clow) pathway changes. Top canonical pathways were identified by top-down analysis using IPA software. Significant top IPA pathways are identified using the criteria of adjusted P value<0.05 and |Z-score|>2. Blue bar indicates a negative z-score and down-regulated pathway. Red bar indicates a positive z-score and up-regulated pathway. Representative top 40 up/down SDE genes involved in these top pathways are listed in Supplementary Table 1 . (E) Overlap analysis for SDE genes in Ly6C MC subsets and top 3 functional pathways (Venn diagram). Venn diagram summarized the total SDE genes and their top 3 pathways in each SDE set in four pairs of comparisons. Numbers depict the amount of SDE genes. Numbers in the parentheses describes the number of pathways. MC, monocyte; MΦ, macrophage; TREM1, The triggering receptor expressed on myeloid cells 1; GPCRs, G-protein-coupled receptors; PFKFB4, 6-phosphofructo-2-kinase/fructose-2,6-biphosphatase 4; SLE, Systemic Lupus Erythematosus, Th1, T helper 1; PKCθ, Protein Kinase C Theta; IL-7, Interleukin 7; NFAT, Nuclear factor of activated T-cells; CHK, Csk-homologous kinase; nNOS, neuronal nitric oxide synthase; PXR, pregnane X receptor; CAR, constitutive androstane receptor.
Figure 4
Figure 4
Immunological signature genes and top functional pathways in Ly6C MC subset from CT and Cbs -/- mice. (A) Identification of immunological SDE genes (secretome, cytokine and surface marker). Volcano plot of all genes demonstrates the expression pattern of SDE genes in four comparison groups. Down-regulated SDE genes are highlighted in green and up-regulated in red (|Log2FC|>1, adj. P<0.01), with Log2FC as x-axis and −Log10(adjust P-value) as y-axis. SDE secretome, cytokine and surface marker were identified using the immunological gene set established in our previous study (PMID: 32179051) from website (https://www.proteinatlas.org/). Top 25 up- and down-regulated SDE genes in all comparisons via IPA are listed in Supplementary Table 2 . (B) Overlap analysis for SDE immunological genes in Ly6C MC subsets and top pathways. Venn diagram summarized the total SDE genes and their top three pathways in each SDE set from four pairs of comparisons. Functional pathways were developed by metascape software mainly using the GO database only in SDE set (>20 SDE genes). The top 3 functional pathways are presented. Numbers depict the amount of SDE genes. Numbers in the parentheses describes the number of pathways. A detailed list of SDE genes and pathway in each SDE set are presented in Supplementary Table 3 . ECM, extracellular matrix; EC, extracellular; IFNγ, interferon gamma; MNC, mononuclear cell; NK, natural killer.
Figure 5
Figure 5
Identification of SDE TF and immunological transcriptional regulatory models. (A) SDE TF in four comparison groups. Volcano plot of all genes demonstrates the expression pattern of SDE TF in four comparison groups. Down-regulated SDE TF are highlighted in green and up-regulated in red (|Log2FC|>1, adj. P<0.01), with Log2FC as x-axis and −Log10(adjust P-value) as y-axis. Top 25 up- and down-regulated SDE TF in all comparisons via IPA are listed in Supplementary Table 2 . (B) Overlap analysis for SDE TF in Ly6C MC subsets and top pathways. Venn diagram summarized the total SDE genes and their top 3 pathways in each SDE TF change groups from four pairs of comparisons. Functional pathways were developed by metascape software using the GO database only in SDE set (>20 SDE genes). The top 3 functional pathways are presented. Numbers depict the amount of SDE TF. Numbers in the parentheses describes the number of pathways. A detailed list of SDE TF and pathway in each SDE set are presented in Supplementary Table 3 . (C) SDE TF and targeted SDE immunological genes. SDE immunological genes were matched with SDE TF by IPA upstream analysis. Transcriptional regulatory relationship between SDE TF and SDE immunological genes was justified by correspondence at the same direction (either positive or negative) and overlapped p-value<0.01 and |z-score|>2. Note that Itgam is also known as CD11b, that Ly6c refers to other Ly6 genes (Ly6.2, Ly6C, Ly6C.2, Ly6C antigen, Ly6a2, Ly6al, Ly6b, Ly6c1, Ly6c2, Ly6f, Ly6g, Ly6i). (D) Representative of CEBPE and PAX5 transcriptional regulatory pathways (Ly6Chigh vs. Ly6Clow in both mice) CEBPE and PAX5 are used as the representative SDE TF to establish transcriptional regulatory network by using IPA upstream analysis. The corresponding expression levels of targeted SDE genes are indicated by colored nodes. (E) Model of transcriptional regulation between Ly6C MC subset differentiation. Model describes potential transcriptional regulatory machinery. In Comparison A, 22 SDE TF (14 up-red and 8 down-blue) are identified in Ly6Chigh MC subset in CT mice. In Comparison B, 19 SDE TF (nine up and 10 down) are identified in Cbs-/- Ly6Chigh MC subset. In Comparison C, 10 SDE TF (five up and five down) are identified in Cbs-/- Ly6Chigh MC subset. While, in Comparison D, 10 SDE TF (five up and five down) are identified in Cbs-/- Ly6Clow MC subset. Top 5 SDE TF are indicated in italic letters, and matched SDE TF in the parentheses. Red letter highlighted the representative up-regulated gene. Blue letter highlighted down-regulated genes. Abbreviations are as that in Figure 2 . RNAP, RNA polymerase, PID, pathway interaction database; HDAC, histone deacetylase. Abbreviation for gene names refer to list in website, https://www.genecards.org/.
Figure 6
Figure 6
Identification of SDE immune checkpoint gene and function implication in Ly6C MC. (A) Expression pattern of SDE immune checkpoint gene in Ly6C MC. Heatmap shows the expression levels of the immune checkpoint gene (receptor and ligand) in Ly6C MC. The color density indicates the average expression of a given gene normalized by z-score. Fifteen pairs of SDE co-stimulatory and 10 pairs of SDE co-inhibitory molecules are identified in four comparison groups. Red-colored background numbers indicate FC>2 (log2FC>1). Green-colored background numbers indicate FC<0.5 (log2FC<-1). The completed list of Immune checkpoint genes is in Supplementary Table 4 . (B) SDE immune checkpoint gene functional implication in mouse MC subsets. This table describes expression pattern and effector function of SDE immune checkpoint (ligand-receptor) in Cbs -/- Ly6C MC. (C) Model of immune checkpoint regulation in Ly6C MC and Cbs -/- mice. In Ly6Chigh MC, downregulation of co-stimulatory receptor molecules implicates suppressed proliferation and upregulation of ligand molecules implicates increased antigen priming and differentiation. Co-inhibitory molecule change support similar biologic function. Cbs -/- MC presented feature of increased receptor cell proliferation and deceased ligand cell differentiation/activation. Upregulated SDE immune checkpoint molecules are marked in red, downregulated in blue. ↑ refers to induce expression by Cbs -/-. ↓ refers to reduce expression by Cbs -/-, ± refers to no changes in Cbs -/-. NK, natural killer cells; TCR, T-cell receptor; ITIM, immunoreceptor tyrosine-based inhibition motif; Other abbreviations are as that in Figure 2 .
Figure 7
Figure 7
Expression profile of immune cell lineage and subset marker in Ly6C MC subset. (A) Expression pattern of newly suggested leukocyte signature genes in Ly6C MC. Heatmap shows the expression levels of the leukocyte signature genes, recently suggested by scRNA-seq study, in Ly6C MC. The color density indicates the average expression of a given gene normalized by z-score. Fold change of newly suggested leukocyte signature gene are present in the Supplementary Table 5 . (B) Association of Ly6C MC with newly suggested leukocyte subset signature genes. Connection of the newly suggested leukocyte signature genes with Ly6C MC subsets are established based on their expression pattern in Ly6C MC subsets. (C) Expression profile of 58 SDE established lineage surface markers in Ly6C MC. (D) Expression profile of 38 SDE established lineage transcription factors in Ly6C MC. Four major immune cell type (MΦ/DC/TC/BC) and their 15 subsets are listed. Lineage SDE surface markers and TF are differentially expressed in four comparison groups in these subsets. Red-colored background numbers indicate FC>2 (log2FC>1). Green-colored background numbers indicate FC<0.5 (log2FC<-1). Justification for Leukocyte lineage specific TF/surface marker are listed in the Supplementary Table 6 . scRNA-seq, single-cell RNA sequencing; MC, monocyte, Cbs, Cystathionine β-synthase; MΦ,macrophage; DC, dendritic cell; MoDC monocyte-derived dendritic cell; TC, T cell, Th2 cell, T helper 2 cell; BC, B cell; APC, antigen-presenting cells; TF, transcription factor; cDC, classical DCs, pDC, plasmacytoid DC; Treg, Regulatory T cells; Tfh, T follicular helper.
Figure 8
Figure 8
Molecule signaling of Ly6C MC to MΦ subset differentiation and to lymphocyte subset functional adaptation. We established two models for molecule signaling of MC differentiation based on their preferential expression of lineage signature TF, surface marker and cytokine using information extracted from Figures 3 , 5 , and 7 . (A) Ly6Chigh MC favors to MΦ subset differentiation and associated molecule signaling. Ly6Chigh MC preferentially expressed lineage signature TF genes of MΦ/DC subsets, suggesting their potential differentiation to MΦ. The indicated immunological and inflammatory pathways lead to various changes of cytokines production, and effector function including T/NK cell proliferation, inflammatory response and calcification. Cbs -/- Ly6Chigh MC exhibited inflammatory cytokine production. (B) Ly6Clow MC shares function with lymphocyte subset (molecule signaling). Ly6Clow MC preferentially expressed lineage signature TF genes of B/T cell subsets, suggesting their potential functional adaptation to lymphocyte subsets. The indicated immunological and inflammatory pathways lead to various changes of cytokines attributed to increased T/B cell activation, host defend, wound healing and anti-inflammatory responds. Cbs -/- Ly6Clow MC exhibited enhance T/B cell activation potential. Expression change and function implication of SDE cytokine genes in Ly6C MC were presented in Supplementary Table 7 . MC, monocyte; DC, dendritic cell; MΦ, macrophage; TREM1, the triggering receptor expressed on myeloid cells; NK, natural killer, TC, T cell; Th1, T helper 1 cell; Tfh, T follicular helper; BC, B cell, NFAT, Ca2+, Calcium; SLE, systemic lupus erythematosus, IL-7, Interleukin 7; NFAT, nuclear factor of activated T-cells; nNOS, neuronal nitric oxide synthase.

Similar articles

Cited by

References

    1. Jakubzick CV, Randolph GJ, Henson PM. Monocyte differentiation and antigen-presenting functions. Nat Rev Immunol (2017) 17:349–62. 10.1038/nri.2017.28 - DOI - PubMed
    1. Kapellos TS, Bonaguro L, Gemund I, Reusch N, Saglam A, Hinkley ER, et al. . Human Monocyte Subsets and Phenotypes in Major Chronic Inflammatory Diseases. Front Immunol (2019) 10:2035. 10.3389/fimmu.2019.02035 - DOI - PMC - PubMed
    1. Fang P, Li X, Dai J, Cole L, Camacho JA, Zhang Y, et al. . Immune cell subset differentiation and tissue inflammation. J Hematol Oncol (2018) 11:97. 10.1186/s13045-018-0637-x - DOI - PMC - PubMed
    1. Yang J, Zhang L, Yu C, Yang XF, Wang H. Monocyte and macrophage differentiation: circulation inflammatory monocyte as biomarker for inflammatory diseases. Biomark Res (2014) 2:1. 10.1186/2050-7771-2-1 - DOI - PMC - PubMed
    1. Yang J, Fang P, Yu D, Zhang L, Zhang D, Jiang X, et al. . Chronic Kidney Disease Induces Inflammatory CD40+ Monocyte Differentiation via Homocysteine Elevation and DNA Hypomethylation. Circ Res (2016) 119:1226–41. 10.1161/CIRCRESAHA.116.308750 - DOI - PMC - PubMed

Publication types

MeSH terms