

Urban population exposure to air pollution in Europe over the last decades
- PMID: 33717794
- PMCID: PMC7937352
- DOI: 10.1186/s12302-020-00450-2
Urban population exposure to air pollution in Europe over the last decades
Abstract
Background: The paper presents an overview of air quality in the 27 member countries of the European Union (EU) and the United Kingdom (previous EU-28), from 2000 to 2017. We reviewed the progress made towards meeting the air quality standards established by the EU Ambient Air Quality Directives (European Council Directive 2008/50/EC) and the World Health Organization (WHO) Air Quality Guidelines by estimating the trends (Mann-Kendal test) in national emissions of main air pollutants, urban population exposure to air pollution, and in mortality related to exposure to ambient fine particles (PM2.5) and tropospheric ozone (O3).
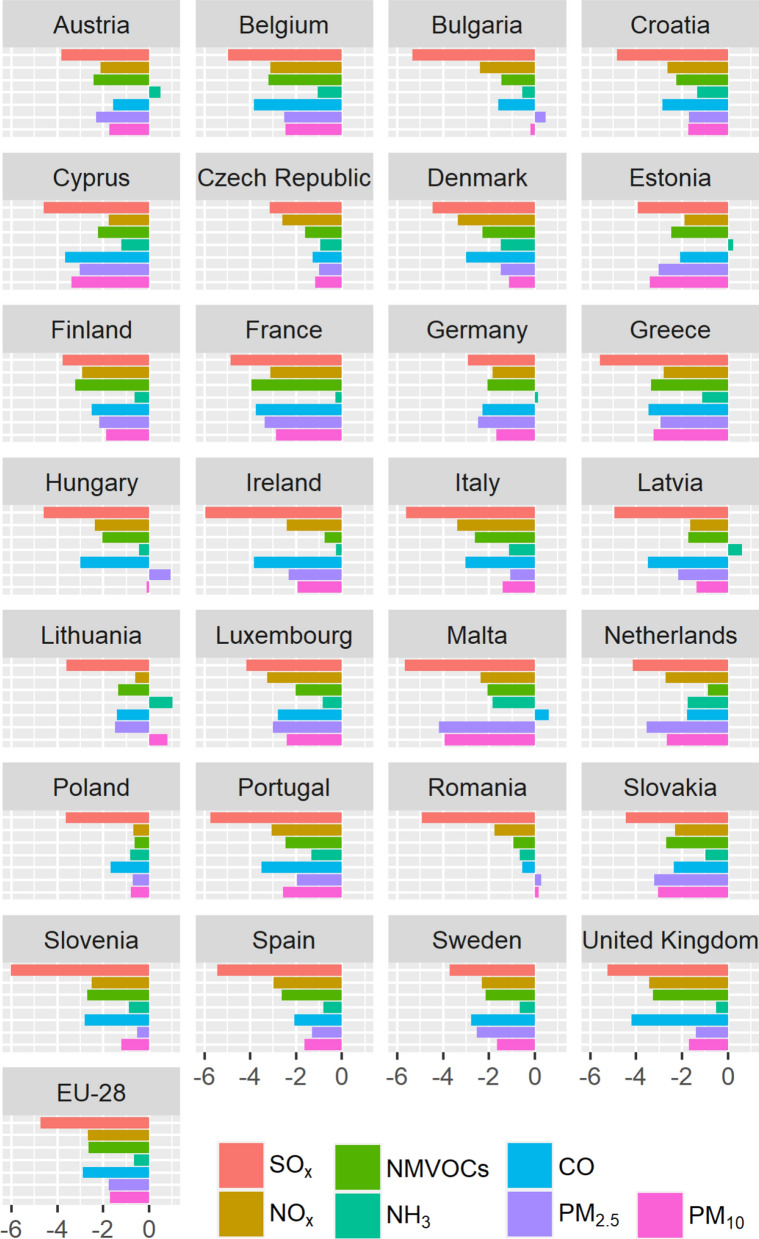
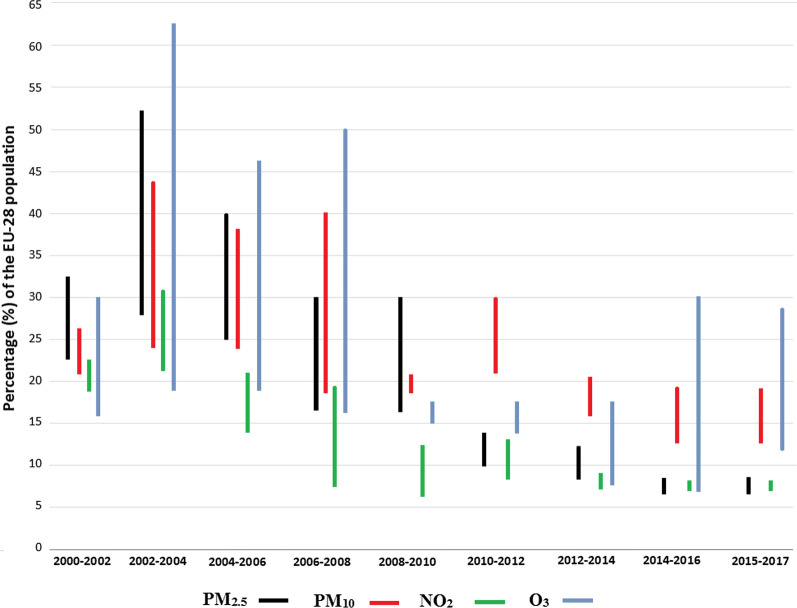
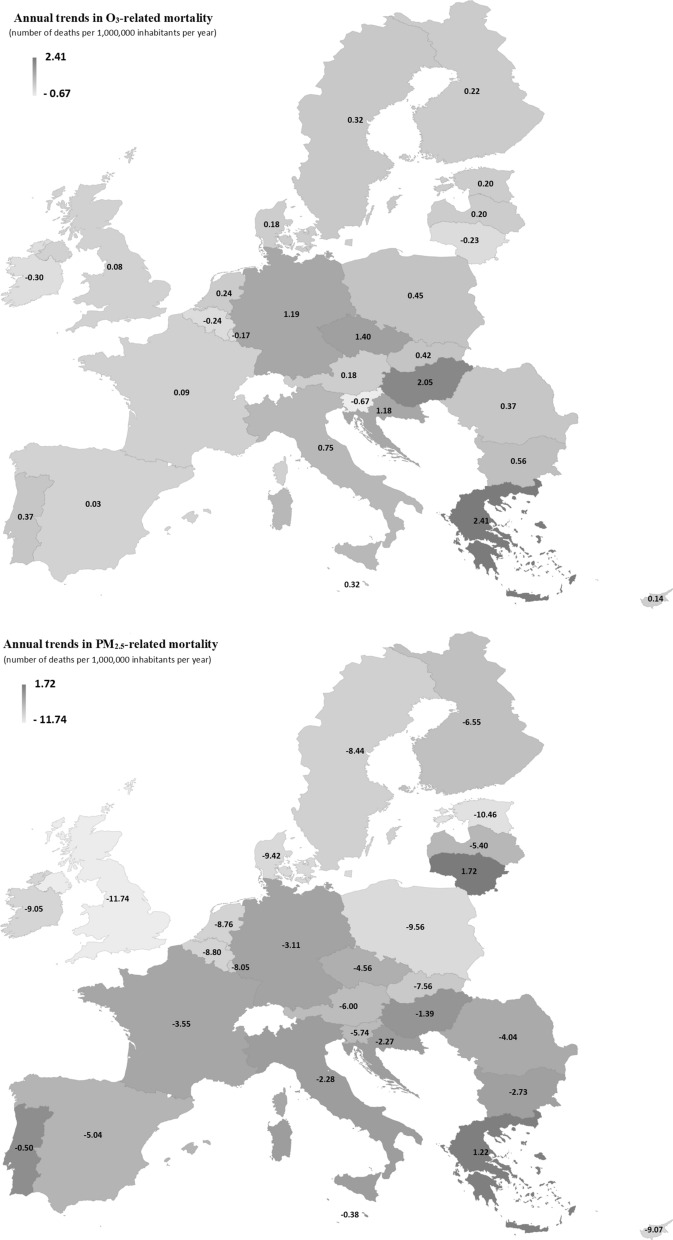
Results: Despite significant reductions of emissions (e.g., sulfur oxides: ~ 80%, nitrogen oxides: ~ 46%, non-methane volatile organic compounds: ~ 44%, particulate matters with a diameter lower than 2.5 µm and 10 µm: ~ 30%), the EU-28 urban population was exposed to PM2.5 and O3 levels widely exceeding the WHO limit values for the protection of human health. Between 2000 and 2017, the annual PM2.5-related number of deaths decreased (- 4.85 per 106 inhabitants) in line with a reduction of PM2.5 levels observed at urban air quality monitoring stations. The rising O3 levels became a major public health issue in the EU-28 cities where the annual O3-related number of premature deaths increased (+ 0.55 deaths per 106 inhabitants).
Conclusions: To achieve the objectives of the Ambient Air Quality Directives and mitigate air pollution impacts, actions need to be urgently taken at all governance levels. In this context, greening and re-naturing cities and the implementation of fresh air corridors can help meet air quality standards, but also answer to social needs, as recently highlighted by the COVID-19 lockdowns.
Keywords: Air pollution; EU-28; Mann–kendall test; Population exposure; Risk assessment; Trend.
© The Author(s) 2021.
Conflict of interest statement
Competing interestsThe authors declare that they have no known competing financial interests or personal relationships that could have appeared to influence the work reported in this paper.
Figures
References
-
- Amoatey P, Sicard P, De Marco A, Khaniabadi YO. Human health risk assessment of long-term exposures to PM2.5 in Rome, Italy. ClinEpidemiol Glob Health. 2019;7:222–227.
-
- Amoatey P, Takdastan A, Sicard P, Hopke PK, Baawain M, Omidvarborna H, De Marco A, Allahyari S, Khanaibadi YO. Short and long-term impacts of ambient ozone on health in Ahvaz, Iran. Hum Ecol Risk Assess. 2019;9:1–16.
-
- Barmpadimos I, Hueglin C, Keller J, Henne S, Prévôt ASH. Influence of meteorology on PM10 trends and variability in Switzerland from 1991 to 2008. Atmos Chem Phys. 2011;11:1813–1835. doi: 10.5194/acp-11-1813-2011. - DOI
LinkOut - more resources
Full Text Sources
Other Literature Sources