. 2021 Jan 4;8(5):2002483.
doi: 10.1002/advs.202002483. eCollection 2021 Mar.

Chemotherapy-Enriched THBS2-Deficient Cancer Stem Cells Drive Hepatocarcinogenesis through Matrix Softness Induced Histone H3 Modifications

Affiliations

Chemotherapy-Enriched THBS2-Deficient Cancer Stem Cells Drive Hepatocarcinogenesis through Matrix Softness Induced Histone H3 Modifications

Kai-Yu Ng et al. Adv Sci (Weinh). .

Abstract

The physical microenvironment is a critical mediator of tumor behavior. However, detailed biological and mechanistic insight is lacking. The present study reveals the role of chemotherapy-enriched CD133+ liver cancer stem cells (CSCs) with THBS2 deficiency. This subpopulation of cells contributes to a more aggressive cancer and functional stemness phenotype in hepatocellular carcinoma (HCC) by remodeling the extracellular matrix (ECM) through the regulation of matrix metalloproteinase (MMP) activity, collagen degradation, and matrix stiffness. The local soft spots created by these liver CSCs can enhance stemness and drug resistance and provide a route of escape to facilitate HCC metastasis. Interestingly, a positive feed-forward loop is identified where a local soft spot microenvironment in the HCC tumor is enriched with CD133 expressing cells that secrete markedly less ECM-modifying THBS2 upon histone H3 modification at its promoter region, allowing the maintenance of a localized soft spot matrix. Clinically, THBS2 deficiency is also correlated with low HCC survival, where high levels of CSCs with low THBS2 expression in HCC are associated with decreased collagen fiber deposits and an invasive tumor front. The findings have implications for the treatment of cancer stemness and for the prevention of tumor outgrowth through disseminated tumor cells.

Keywords: CD133; THBS2; cancer stemness; hepatocellular carcinomas; histone modifications; matrix stiffness; mechanoepigenetics; metastasis.


Conflict of interest statement

The authors declare no conflict of interest.

Figures

Figure 1
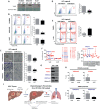
Figure 1
Chemotherapy‐enriched THBS2‐deficient CD133+ liver cancer stem cells confer an enhanced ability to degrade the ECM by modulating MMP activity. A) Representative flow cytometry dot plots and quantification of CD133 expression in HCC cells with or without 5‐fluorouracil (5‐FU) treatment. DMSO was used as a control. B) Representative H&E and immunohistochemical staining for CD133 expression in orthotopic liver MHCC97L xenograft tumors with or without 5‐FU treatment. Bar graph shows quantitation of number of CD133+ cells. DMSO was used as a control. Scale bar: 50 µm. C) Representative images and quantification of gelatin degradation assays of sorted CD133+ cancer stem cell versus CD133− noncancer stem cell subpopulations in HCC cells. Red arrows point to the area of degraded gelatin. Scale bar: 10 µm. D) PCR array profiles of genes related to extracellular matrix and adhesion molecules. Venn diagrams (top) showing the number of downregulated (3) and upregulated genes (5) in CD133+ versus CD133− in 2 of 3 subpopulation sorted by HCC cell type (PLC8024, SNU182, and Huh7). Heatmap (bottom) of commonly dysregulated genes as analyzed by PCR array. Expression values were normalized to the expression of 5 housekeeping genes and presented as fold changes in CD133+ to CD133− subpopulations. E) Western blot validation of secreted THBS2 proteomic expression in sorted CD133 subpopulation of HCC cells. Coomassie blue was used as the loading control. F) Image showing the rationale used for THBS2 identification. G) Gelatin zymography for MMP2 and MMP9 activities and H) representative images and quantification of gelatin degradation assays in HCC cells with or without modulated THBS2 expression. Coomassie blue was used as the loading control. White arrows point to the area of degraded gelation. Scale bar: 10 µm. EV refers to the empty vector, OE refers to THBS2 overexpression, NTC refers to the nontarget control, and 1137 and 2606 refers to the two THBS2 shRNA knockdown clones. Data expressed as the mean ± SEM; * p < 0.05, ** p < 0.01, and *** p < 0.001 from A–C) Student's t‐test or H) one‐way ANOVA with Bonferroni's post‐test.
Figure 2
Figure 2
Conditioned medium enriched with THBS2 regulates cancer and stemness properties in HCC cells via matrix gel modification. HCC cells treated with conditioned medium (CM) collected from corresponding HCC cells with THBS2 stably overexpressed or repressed grown in 3D matrix gel. Representative images and quantification of the number of cells that A) migrated or B) invaded. C) In vitro limiting dilution spheroid analysis. D) Representative flow cytometry dot plots and quantification of CD133 expressing cells. E) Representative Annexin V apoptosis dot plots and quantification following treatment with 5‐fluorouracil (5‐FU). EV refers to empty vector, OE refers to THBS2 overexpression, NTC refers to nontarget control, 1137 and 2606 refer to two THBS2 shRNA knockdown clones, PI refers to propidium iodide, and 5‐FU refers 5‐fluorouracil. Data expressed as the mean ± SEM; * p < 0.05, ** p < 0.01, and *** p < 0.001 from A,B,D,E) one‐way ANOVA with Bonferroni's post‐test or C) chi‐square test.
Figure 3
Figure 3
THBS2 deficiency promotes collagen degradation and decreases matrix stiffness and metastatic dissemination of HCC tumors. A) Collagen gel contraction assay of HCC cells with or without THBS2 expression modulation and grown in 3D matrix gel. B) Collagen gel contraction assay of the HCC cells and patient‐derived organoids grown in 3D matrix gel in the absence or presence of varying concentrations of recombinant THBS2 (rTHBS2). C) In vivo and ex vivo images of the luciferase signal in BALB/C nude mice intrahepatically injected with 400 000 MHCC97L HCC cells primed with recombinant THBS2 (rTHBS2)‐modified matrix gel. PBS was used as a control. Box plot on the right showing the number of lung metastasis nodules recorded. Graph plots at the bottom showing the bioluminescence signal of the ex vivo imaged livers and lungs resected. n = 5 mice per group. D) Representative images showing H&E, Masson's trichrome and picrosirius red staining, and immunohistochemical staining for THBS2, CD133, and CD34 expression in serial sections of orthotopic liver xenograft tumors. Scale bar: 100 µm. E) Representative elastography images showing the size of tumors (B‐mode image analysis) and stiffness of the tumor tissue (SWE image analysis). Scale bar: 2 mm. The mean elasticity values reflecting the stiffness of the tumors are presented in the box plot (left). Box plots (right) show the stiffness measurements of ex vivo livers harvested from the indicated mouse models as determined by indenter tests. EV refers to empty vector, OE refers to THBS2 overexpression, SWE refers to shear wave elastography, NTC refers to nontarget control, 1137 and 2606 refer to two THBS2 shRNA knockdown clones, and rTHBS2 refers to recombinant THBS2. Data expressed as the mean ± SEM; * p < 0.05, ** p < 0.01, and *** p < 0.001 from C,E) Student's t‐test or A,B) one‐way ANOVA with Bonferroni's post‐test.
Figure 4
Figure 4
Recombinant THBS2 sensitizes HCC tumors to 5‐FU chemotherapy, diminishes their metastatic ability, and reduces CD133 expression in vivo. A) Images of resected liver tumors of BALB/C nude mice intrahepatically injected with 400 000 MHCC97L cells primed with or without recombinant THBS2 (rTHBS2)‐modified matrix gel and with or without 5‐FU treatment. Graph plots of the bioluminescence signal of the ex vivo imaged livers and lungs resected from BALB/C nude mice intrahepatically injected with MHCC97L cells primed with or without recombinant THBS2 (rTHBS2)‐modified matrix gel and with or without 5‐FU treatment. PBS/DMSO was used as a control. Box plots showing the tumor weight in the liver and the number of lung metastasis nodules. n = 5 mice per group. B) Representative images showing H&E, Masson's trichrome and picrosirius red staining, and immunohistochemical staining for THBS2, CD133, cleaved caspase 3 expression, as well as apoptosis by TUNEL as in serial sections of orthotopic liver xenograft tumors. Scale bar: 50 µm, with the exception of cleaved caspase 3 and TUNEL where scale bar is at 100 µm. C) Representative elastography images showing the size of the tumors (B‐mode image analysis) and the stiffness of the tumor tissue (SWE image analysis). Scale bar: 2 mm. The mean elasticity values reflecting the stiffness of the tumors are presented in the box plot (left). Box plots (right) show the stiffness measurements of ex vivo livers harvested from the above mouse model by indenter tests. SWE refers to shear wave elastography, rTHBS2 refers to recombinant THBS2, and 5‐FU refers to 5‐fluorouracil. Data expressed as the mean ± SEM; * p < 0.05, ** p < 0.01, and *** p < 0.001 from one‐way ANOVA with Bonferroni's post‐test.
Figure 5
Figure 5
THBS2 expression is frequently downregulated in HCC, and its deficiency is tightly associated with low HCC survival. A) Box and waterfall plot analyses of THBS2 mRNA expression in nontumor liver and matched HCC tissue from patients in both the Hong Kong (n = 20) and Guangzhou (n = 67) cohorts. B) Kaplan–Meier survival analysis comparing recurrence‐free survival of HCC patients with different THBS2 mRNA expression levels in the Hong Kong (n = 31) and TCGA LIHC (liver ‐ hepatocellular carcinoma) (n = 361) cohorts. C) Representative immunohistochemical analysis of THBS2 expression in HCC tumor and adjacent nontumor liver tissue. Scale bar: 25 µm. Box plot showing the distribution of THBS2 expression levels at different intensities in the tissue microarray of 111 matched nontumor liver and HCC clinical samples. D) Histological examination of areas in HCC clinical tissue samples with high CD133 expression and low THBS2 expression (top) or absent/low CD133 expression and high THBS2 expression (bottom). The samples were stained with Masson's trichrome and picrosirius red stains for visualization of the connective tissue and collagen fiber deposits as well as for CD133 and THBS2. Scale bar: 50 µm. Box plot showing the number of cases showing high and low CD133 expression or high and low THBS2 expression in soft or stiff HCC tumors (n = 8 matched cases examined). Data expressed as the mean ± SEM; * p < 0.05, ** p < 0.01, and *** p < 0.001 from Student's t‐test.
Figure 6
Figure 6
A soft microenvironment promotes aggressive cancer properties, induces CD133 expression, and suppresses THBS2 expression through histone H3 modifications. A) Western blots showing the secreted THBS2 proteomic expression in HCC cells grown in soft (0.25 kPa) or stiff (15 kPa) matrix. Coomassie blue was used as the loading control. B) Representative flow cytometry dot plots and quantification of CD133 expression in HCC cells grown in soft and stiff matrix. C) Representative images and quantification of the patient‐derived HCC organoids grown in soft (0.25 kPa) or stiff (15 kPa) matrix. Images show organoid size. The bar graph shows the number of organoids recorded per 1000 cells. Representative images and quantification of the number of patient‐derived HCC organoids that migrated and invaded when grown in soft or stiff matrix. Scale bar: 100 µm for proliferation and 20 µm for migration and invasion. D) Representative flow cytometry dot plots and quantification of CD133 expression in the patient‐derived HCC organoids grown in soft or stiff matrix. E) Representative Annexin V apoptosis dot plots and quantification of patient‐derived HCC organoids grown in soft or stiff matrix following treatment with 5‐fluorouracil (5‐FU). 5‐FU refers to 5‐fluorouracil and PI refers to propidium iodide. F) Graph plots of absolute H3 modification and relative changes to H3 modifications in MHCC97L cells cultured in soft or stiff matrix. G) Western blot validation of global changes in transcriptional activation (H3K4me3 and H3K9ac) and transcriptional silencing marks (H3K9me3 and H3K27me3) in MHCC97L cells cultured in soft or stiff matrix. H) Bar graph summary of ChIP‐qPCR analysis of the enrichment of transcriptional activation (H3K4me3 and H3K9ac) and transcriptional silencing marks (H3K9me3 and H3K27me3) at the respective promoter regions of PROM1/CD133 and THBS2, respectively. I) Schematic diagram illustrating the findings of this study showing that extracellular matrix remodeling by chemotherapy 5‐FU‐enriched THBS2‐deficient CD133 cancer stem cells can provide a route of escape that leads to HCC metastasis. In brief, 5‐FU enriches for CD133 expressing cells with deficient THBS2 expression. THBS2, which is a known extracellular matrix (ECM)‐modifying protein, has the ability to alter MMP2/MMP9 activity and thus collagen and matrix stiffness, which leads to altered cancer and stemness properties. This local soft microenvironment then induces mechanoepigenetic changes to enhance CD133 expression and suppress THBS2 expression through histone H3 modifications at their respective promoter regions, facilitating a positive feedback loop that supports the clonogenic expansion of a subpopulation of HCC cells with high CD133 expression and low THBS2 expression. Data expressed as the mean ± SEM; * p < 0.05, ** p < 0.01, and *** p < 0.001 from Student's t‐test.

Similar articles

Cited by

References

    1. Zhang J., Li L., J. Biol. Chem. 2008, 283, 9499. - PubMed
    1. Plaks V., Kong N., Werb Z., Cell Stem Cell 2015, 16, 225. - PMC - PubMed
    1. Levental K. R., Yu H., Kass L., Lakins J. N., Egeblad M., Erler J. T., Fong S. F., Csiszar K., Giaccia A., Weninger W., Yamauchi M., Gasser D. L., Weaver V. M., Cell 2009, 3, 891. - PMC - PubMed
    1. Paszek M. J., Zahir N., Johnson K. R., Lakins J. N., Rozenberg G. I., Gefen A., Reinhart‐King C. A., Margulies S. S., Dembo M., Boettiger D., Hammer D. A., Weaver V. M., Cancer Cell 2005, 8, 241. - PubMed
    1. Tan Y., Tajik A., Chen J., Jia Q., Chowdhury F., Wang L., Chen J., Zhang S., Hong Y., Yi H., Wu D. C., Zhang Y., Wei F., Poh Y. C., Seong J., Singh R., Lin L. J., Doganay S., Li Y., Jia H., Ha T., Wang Y., Huang B., Wang N., Nat. Commun. 2014, 5, 4619. - PMC - PubMed

LinkOut - more resources