. 2021 Jan 6;8(5):2002738.
doi: 10.1002/advs.202002738. eCollection 2021 Mar.

Mitochondrial Damage-Induced Innate Immune Activation in Vascular Smooth Muscle Cells Promotes Chronic Kidney Disease-Associated Plaque Vulnerability

Affiliations

Mitochondrial Damage-Induced Innate Immune Activation in Vascular Smooth Muscle Cells Promotes Chronic Kidney Disease-Associated Plaque Vulnerability

Xianjin Bi et al. Adv Sci (Weinh). .

Abstract

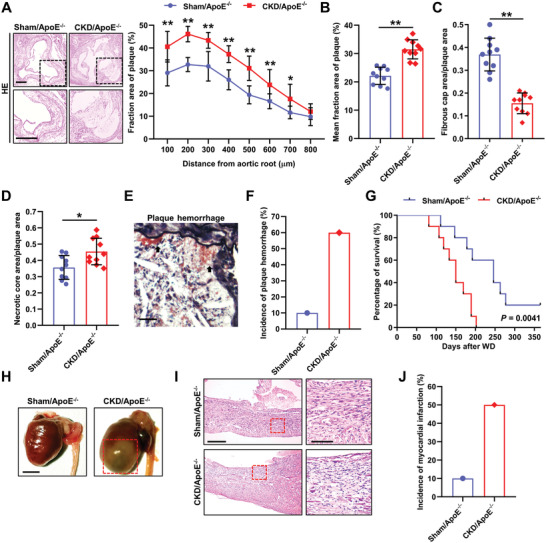
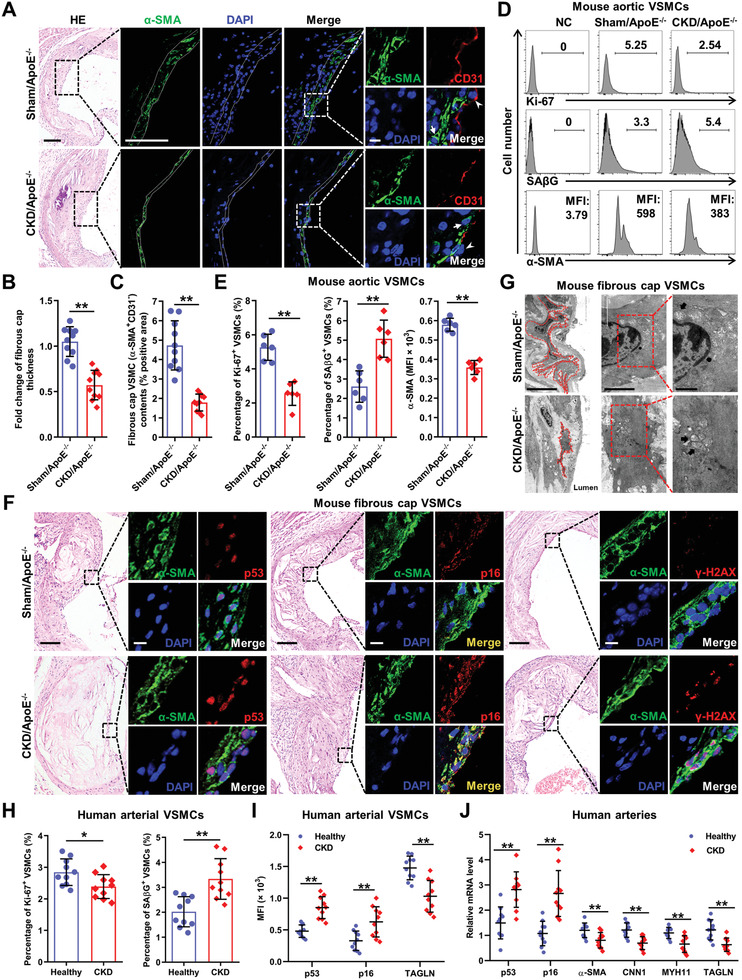
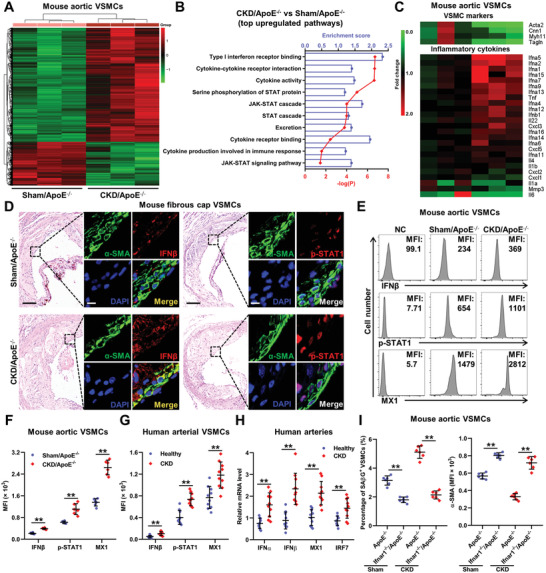
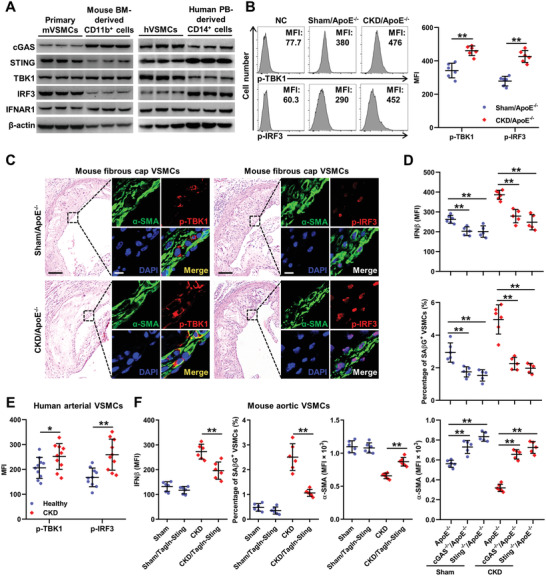
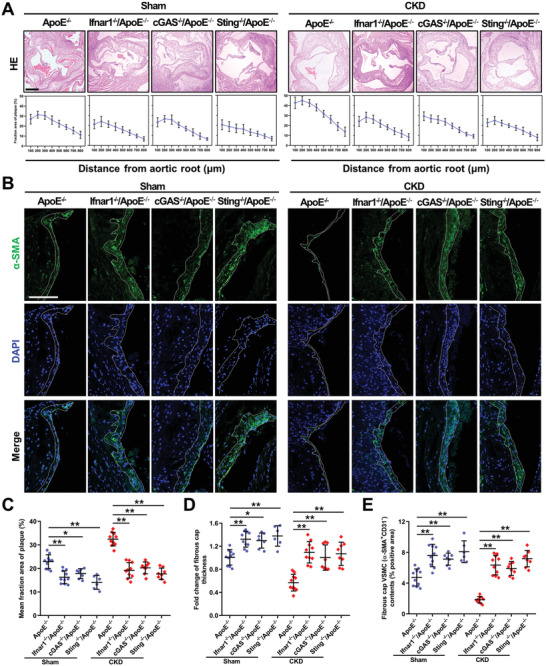
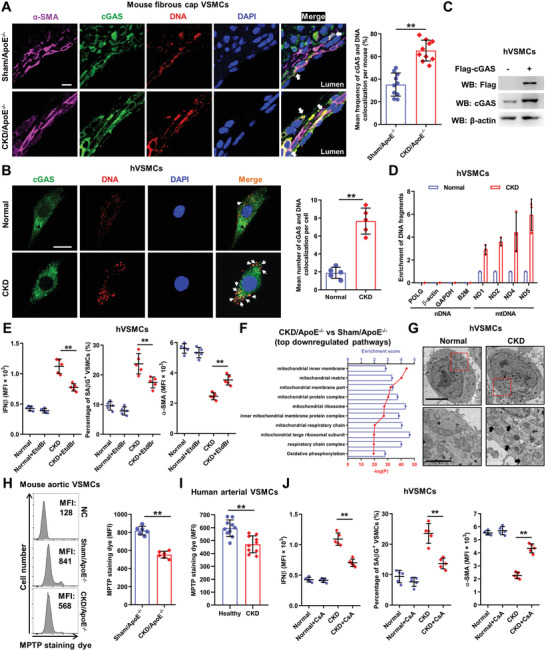
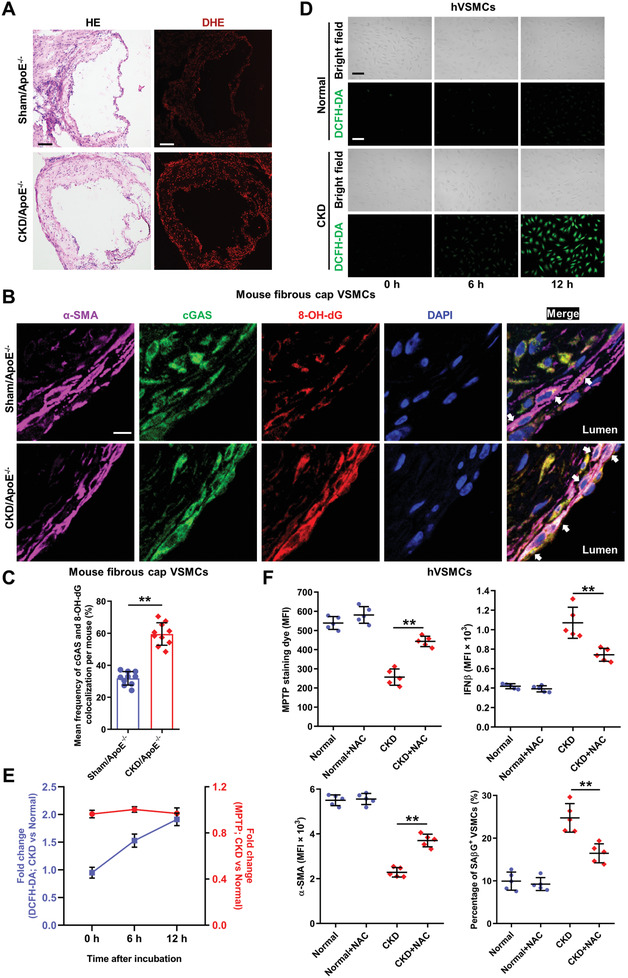
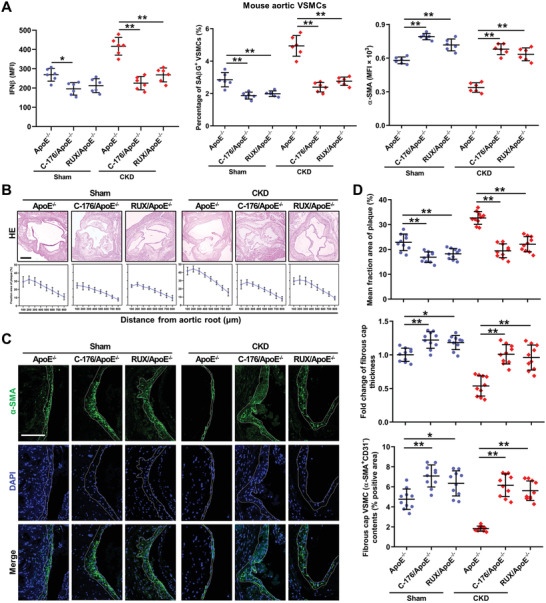
Chronic kidney disease (CKD) is associated with accelerated atherosclerosis progression and high incidence of cardiovascular events, hinting that atherosclerotic plaques in CKD may be vulnerable. However, its cause and mechanism remain obscure. Here, it is shown that apolipoprotein E-deficient (ApoE-/-) mouse with CKD (CKD/ApoE-/- mouse) is a useful model for investigating the pathogenesis of plaque vulnerability, and premature senescence and phenotypic switching of vascular smooth muscle cells (VSMCs) contributes to CKD-associated plaque vulnerability. Subsequently, VSMC phenotypes in patients with CKD and CKD/ApoE-/- mice are comprehensively investigated. Using multi-omics analysis and targeted and VSMC-specific gene knockout mice, VSMCs are identified as both type-I-interferon (IFN-I)-responsive and IFN-I-productive cells. Mechanistically, mitochondrial damage resulting from CKD-induced oxidative stress primes the cyclic GMP-AMP synthase-stimulator of interferon genes (cGAS-STING) pathway to trigger IFN-I response in VSMCs. Enhanced IFN-I response then induces VSMC premature senescence and phenotypic switching in an autocrine/paracrine manner, resulting in the loss of fibrous cap VSMCs and fibrous cap thinning. Conversely, blocking IFN-I response remarkably attenuates CKD-associated plaque vulnerability. These findings reveal that IFN-I response in VSMCs through immune sensing of mitochondrial damage is essential for the pathogenesis of CKD-associated plaque vulnerability. Mitigating IFN-I response may hold promise for the treatment of CKD-associated cardiovascular diseases.

Keywords: atherosclerosis; chronic kidney disease; cyclic GMP‐AMP synthase‐stimulator of interferon genes pathway; plaque vulnerability; vascular smooth muscle cell.


Conflict of interest statement

The authors declare no conflict of interest.

Figures

Figure 1
Figure 1
CKD/ApoE−/− mouse is a useful model for investigating the pathogenesis of plaque vulnerability. A) Representative hematoxylin and eosin (HE) staining and the fraction area of multiple sections of aortic root plaques in Sham/ApoE−/− and CKD/ApoE−/− mice (n = 10). Scale bars, 200 µm. The box indicates the region magnified in the lower panels. B) Mean fraction area of aortic root plaques in Sham/ApoE−/− and CKD/ApoE−/− mice (n = 10). C,D) Relative areas of fibrous cap and necrotic core in aortic root plaques of Sham/ApoE−/− and CKD/ApoE−/− mice (n = 10). E) Representative Movat's stain in BCA plaque. The arrow indicates plaque hemorrhage. Scale bar, 25 µm. F) Incidence of plaque hemorrhage in BCA plaques of Sham/ApoE−/− and CKD/ApoE−/− mice. G) Kaplan–Meier survival analysis of Sham/ApoE−/− and CKD/ApoE−/− mice (n = 10). H) Representative hearts at postmortem examination of Sham/ApoE−/− and CKD/ApoE−/− mice. The red box indicates the myocardial infarction region manifested by pale and discolored patches, accompanied by enlarged heart. Scale bar, 5 mm. I) Representative HE staining of the hearts from Sham/ApoE−/− and CKD/ApoE−/− mice. The box indicates the myocardial infarction region magnified in the right panels. Scale bar (left panels), 250 µm. Scale bar (right panels), 100 µm. J) Incidence of myocardial infarction in Sham/ApoE−/− and CKD/ApoE−/− mice. Data represent mean ± SD. *p < 0.05, **p < 0.01, two‐tailed Student's t‐test was applied to (A–D). Log‐rank (Mantel‐Cox) test was applied to (G).
Figure 2
Figure 2
VSMC premature senescence and phenotypic switching contribute to plaque vulnerability in CKD/ApoE−/− mice. A) Representative images of HE, α‐SMA, and CD31 staining in aortic root plaques of Sham/ApoE−/− and CKD/ApoE−/− mice. The dashed lines delineate the fibrous cap area. The box indicates the region magnified in the right panels. The arrow indicates fibrous cap VSMCs (α‐SMA+CD31). The arrowhead indicates endothelial cells (α‐SMACD31+). Scale bar (HE), 100 µm. Scale bar (α‐SMA staining), 40 µm. Scale bar (α‐SMA and CD31 double staining), 10 µm. B,C) Quantification of the fold change of fibrous cap thickness and fibrous cap VSMC (α‐SMA+CD31) contents in aortic root plaques of Sham/ApoE−/− and CKD/ApoE−/− mice (n = 10). D) Representative FC analysis of Ki‐67, SAβG, and α‐SMA expression levels in aortic VSMCs of Sham/ApoE−/− and CKD/ApoE−/− mice. E) The percentages of Ki‐67+ and SAβG+ VSMCs, as well as, the mean fluorescence intensity (MFI) of α‐SMA in aortic VSMCs of Sham/ApoE−/− and CKD/ApoE−/− mice (n = 6). F) Representative images of HE, p53, p16, and γ‐H2AX staining in fibrous cap VSMCs of Sham/ApoE−/− and CKD/ApoE−/− mice. Scale bar (HE), 100 µm. Scale bar (IF), 10 µm. G) Representative transmission electron microscopy images of fibrous cap VSMCs in aortic root of Sham/ApoE−/− and CKD/ApoE−/− mice. The dashed lines delineate the fibrous cap VSMCs. The box indicates the region magnified in the right panels. The arrow indicates the swollen and vacuolated mitochondria in fibrous cap VSMCs. Scale bar (left panels), 10 µm. Scale bar (middle panels), 2 µm. Scale bar (right panels), 1 µm. H,I) The percentages of Ki‐67+ and SAβG+ VSMCs, as well as, the MFIs of p53, p16, and TAGLN in arterial VSMCs of healthy people and CKD patients (n = 10). J) Relative mRNA expression levels of p53, p16, α‐SMA, CNN1, MYH11, and TAGLN in arteries from healthy people and CKD patients (n = 10). Data represent mean ± SD. **p < 0.05, **p < 0.01, two‐tailed Student's t‐test. DAPI, 4,6‐diamidino‐2‐phenylindole; NC, negative control.
Figure 3
Figure 3
IFN‐I response promotes VSMC premature senescence and phenotypic switching in CKD/ApoE−/− mice. A) The heat maps show genes that differently expressed in aortic VSMCs of Sham/ApoE−/− and CKD/ApoE−/− mice. B) KEGG and GO enrichment analysis of top upregulated pathways in aortic VSMCs of CKD/ApoE−/− mice. C) The heat maps show the relative expression levels of VSMC markers and inflammation cytokines based on the integrated microarray analysis of aortic VSMCs of Sham/ApoE−/− and CKD/ApoE−/− mice. D) Representative images of HE, IFNβ and p‐STAT1 staining in fibrous cap VSMCs of Sham/ApoE−/− and CKD/ApoE−/− mice. Scale bar (HE), 100 µm. Scale bar (IF), 10 µm. E) Representative FC analysis of IFNβ, p‐STAT1, and MX1 expressions in aortic VSMCs of Sham/ApoE−/− and CKD/ApoE−/− mice. F) The MFIs of IFNβ, p‐STAT1, and MX1 in aortic VSMCs of Sham/ApoE−/− and CKD/ApoE−/− mice (n = 6). G) The MFIs of IFNβ, p‐STAT1, and MX1 in arterial VSMCs of healthy people and CKD patients (n = 10). H) Relative mRNA expression levels of IFNα, IFNβ, IRF7, and MX1 in arteries from healthy people and CKD patients (n = 10). I) The percentage of SAβG+ VSMCs and the MFI of α‐SMA in VSMCs of Sham/ApoE−/−, Sham/Ifnar1−/−/ApoE−/−, CKD/ApoE−/−, and CKD/Ifnar1−/−/ApoE−/− mice (n = 6). Data represent mean ± SD. **p < 0.01, two‐tailed Student's t‐test was applied to (F–H); one‐way ANOVA was applied to (I).
Figure 4
Figure 4
cGAS‐STING pathway activation is responsible for CKD‐induced IFN‐I response in VSMCs. A) Representative WB analysis of typical genes in the cGAS‐STING pathway including cGAS, STING, TBK1, IRF3, and IFNAR1 in indicated cells. B) Representative FC analysis and the quantification of p‐TBK1 and p‐IRF3 expression levels in aortic VSMCs of Sham/ApoE−/− and CKD/ApoE−/− mice (n = 6). C) Representative images of HE, p‐TBK1 and p‐IRF3 staining in fibrous cap VSMCs of Sham/ApoE−/− and CKD/ApoE−/− mice. Scale bar (HE), 100 µm. Scale bar (IF), 10 µm. D) The percentage of SAβG+ VSMCs, as well as the MFIs of IFNβ and α‐SMA in aortic VSMCs from Sham/ApoE−/− (n = 6), Sham/cGAS−/−/ApoE−/− (n = 5), Sham/Sting−/−/ApoE−/− (n = 5), CKD/ApoE−/− (n = 6), CKD/cGAS−/−/ApoE−/− (n = 5), and CKD/Sting−/−/ApoE−/− (n = 5) mice. E) The MFIs of p‐TBK1 and p‐IRF3 in arterial VSMCs of healthy people and CKD patients (n = 10). F) The percentage of SAβG+ VSMCs, as well as, the MFIs of IFNβ and α‐SMA in VSMCs from Sham, Sham/Tagln‐Sting, CKD, CKD/Tagln‐Sting mice (n = 6). Data represent mean ± SD. *p < 0.05, **p < 0.01, two‐tailed Student's t‐test was applied to (B,E); one‐way ANOVA was applied to (D,F).
Figure 5
Figure 5
Defect in the cGAS‐STING pathway or IFN‐I signaling mitigates AS progression and plaque vulnerability. A) Representative images of HE and the fraction area of multiple sections of aortic root plaques of Sham/ApoE−/− (n = 10), Sham/Ifnar1−/−/ApoE−/− (n = 10), Sham/cGAS−/−/ApoE−/− (n = 7), Sham/Sting−/−/ApoE−/− (n = 6), CKD/ApoE−/− (n = 10), CKD/Ifnar1−/−/ApoE−/− (n = 10), CKD/cGAS−/−/ApoE−/− (n = 8), and CKD/Sting−/−/ApoE−/− (n = 8). B) Representative images of α‐SMA staining in aortic root plaques of Sham/ApoE−/−, Sham/Ifnar1−/−/ApoE−/−, Sham/cGAS−/−/ApoE−/−, Sham/Sting−/−/ApoE−/−, CKD/ApoE−/−, CKD/Ifnar1−/−/ApoE−/−, CKD/cGAS−/−/ApoE−/−, and Sting−/−/CKD/ApoE−/− mice. Scale bar (HE), 200 µm. Scale bar (IF), 100 µm. C–E) The mean fraction area of plaque, fold change of fibrous cap thickness and fibrous cap VSMC contents in the aortic root of Sham/ApoE−/− (n = 10), Sham/Ifnar1−/−/ApoE−/− (n = 10), Sham/cGAS−/−/ApoE−/− (n = 7), Sham/Sting−/−/ApoE−/− (n = 6), CKD/ApoE−/− (n = 10), CKD/Ifnar1−/−/ApoE−/− (n = 10), CKD/cGAS−/−/ApoE−/− (n = 8), and CKD/Sting−/−/ApoE−/− (n = 8). Data represent mean ± SD. *p < 0.05, **p < 0.01, one‐way ANOVA.
Figure 6
Figure 6
Mitochondrial damage‐induced mitochondrial DNA (mtDNA) release is central to CKD‐induced IFN‐I response in VSMCs. A) Representative images and quantification of cGAS and DNA colocalization in fibrous cap VSMCs of Sham/ApoE−/− and CKD/ApoE−/− mice (n = 10 mice). The arrow indicates cGAS and DNA colocalization in fibrous cap VSMCs. Scale bar, 10 µm. B) Representative images and quantification of cGAS and DNA colocalization in hVSMCs incubated with normal or CKD serum (n = 5 independent experiments). The arrow indicates cGAS and DNA colocalization. Scale bar, 10 µm. C) Representative WB analysis of hVSMCs transduced with an expression lentivirus encoding Flag‐cGAS. D) Relative enrichment of DNA fragments as indicated using an anti‐Flag antibody to coprecipitate DNA in hVSMCs incubated with normal or CKD serum (n = 3). E) The percentage of SAβG+ hVSMCs, as well as, the MFIs of IFNβ and α‐SMA in hVSMCs incubated with normal or CKD serum after EtdBr pretreatment (n = 5). F) KEGG and GO enrichment analysis of top downregulated pathways in aortic VSMCs of CKD/ApoE−/− mice based on the microarray data. G) Representative TEM images of mitochondria in hVSMCs incubated with normal or CKD serum. The box indicates the region magnified in the down panels. The arrow indicates the defect mitochondria. Scale bar (upper panels), 5 µm. Scale bar (down panels), 2 µm. H) Representative FC analysis and quantification of MPTP permeability in aortic VSMCs of Sham/ApoE−/− and CKD/ApoE−/− mice (n = 6). I) MPTP permeability in arterial VSMCs of healthy people and CKD patients (n = 10). J) The percentage of SAβG+ hVSMCs, as well as, the MFIs of IFNβ and α‐SMA in hVSMCs incubated with normal or CKD serum after CsA pretreatment (n = 5). **p < 0.01, two‐tailed Student's t‐test was applied to (A,B,H,I); one‐way ANOVA was applied to (E,J). Oligo, oligomycin; FCCP, fluoro‐carbonyl cyanide phenylhydrazone; Rot, rotenone; Ant, antimycin A.
Figure 7
Figure 7
Oxidative stress plays a key role in CKD‐induced mitochondrial damage and IFN‐I response in VSMCs. A) Representative images of HE and dihydroethidium (DHE) staining in aortic root plaques of Sham/ApoE−/− and CKD/ApoE−/− mice. Scale bar (HE), 100 µm. Scale bar (DHE), 100 µm. B) Representative images of cGAS and 8‐hydroxy‐2'‐deoxyguanosine (8‐OH‐dG) colocalization in fibrous cap VSMCs of Sham/ApoE−/− and CKD/ApoE−/− mice. The arrow indicates cGAS and 8‐OH‐dG colocalization in fibrous cap VSMCs. Scale bar, 10 µm. C) Frequency of cGAS and 8‐OH‐dG colocalization in the fibrous cap VSMCs of Sham/ApoE−/− and CKD/ApoE−/− mice (n = 10 mice). D) Representative images of 2', 7'‐dichlorodihydrofluorescein diacetate (DCFH‐DA) staining in hVSMCs incubated with normal or CKD serum at indicated time. Scale bar, 50 µm. E) Fold changes of the MFIs of DCFH‐DA and MPTP in CKD serum‐incubated hVSMCs after normalization to the Normal group (n = 5). F) The MPTP permeability in hVSMCs, the percentage of SAβG+ hVSMCs, as well as, the MFIs of IFNβ and α‐SMA in hVSMCs incubated with normal or CKD serum after NAC pretreatment (n = 5). **p < 0.01, two‐tailed Student's t‐test was applied to (C); one‐way ANOVA was applied to (F).
Figure 8
Figure 8
Restraining IFN‐I response is a potential therapeutic avenue for mitigating AS progression and plaque vulnerability. A) The percentage of SAβG+ VSMCs, as well as, the MFIs of IFNβ and α‐SMA in aortic VSMCs from Sham/ApoE−/− and CKD/ApoE−/− mice after C‐176 or RUX treatment (n = 6). B) Representative images of HE and the fraction area of multiple sections of aortic root plaques of Sham/ApoE−/− and CKD/ApoE−/− mice after C‐176 or RUX treatment (n = 10). Scale bar, 200 µm. C) Representative images of α‐SMA staining in aortic root plaques of Sham/ApoE−/− and CKD/ApoE−/− mice treated with or without C‐176 or RUX. Scale bar, 100 µm. D) The mean fraction area of plaque, fold change of fibrous cap thickness, and fibrous cap VSMC contents in the aortic root of Sham/ApoE−/− and CKD/ApoE−/− mice after C‐176 or RUX treatment (n = 10).

References

    1. Jha V., Garcia‐Garcia G., Iseki K., Li Z., Naicker S., Plattner B., Saran R., Wang A. Y.‐M., Yang C.‐W., Lancet 2013, 382, 260. - PubMed
    1. Drüeke T. B., Massy Z. A., Nat. Rev. Nephrol. 2010, 6, 723. - PubMed
    1. Bro S., J. Am. Soc. Nephrol. 2003, 14, 2466. - PubMed
    1. Yang K., Du C., Wang X., Li F., Xu Y., Wang S., Chen S., Chen F., Shen M., Chen M., Hu M., He T., Su Y., Wang J., Zhao J., Blood 2017, 129, 2667. - PubMed
    1. Libby P., Pasterkamp G., Eur. Heart J. 2015, 36, 2984. - PubMed