Review
. 2021 Jan 15;8(5):2003033.
doi: 10.1002/advs.202003033. eCollection 2021 Mar.

Current Advances in Black Phosphorus-Based Drug Delivery Systems for Cancer Therapy

Affiliations
Review

Current Advances in Black Phosphorus-Based Drug Delivery Systems for Cancer Therapy

Wenxin Liu et al. Adv Sci (Weinh). .

Abstract

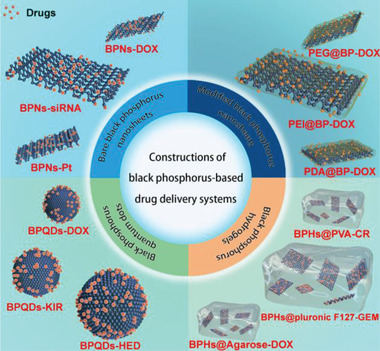
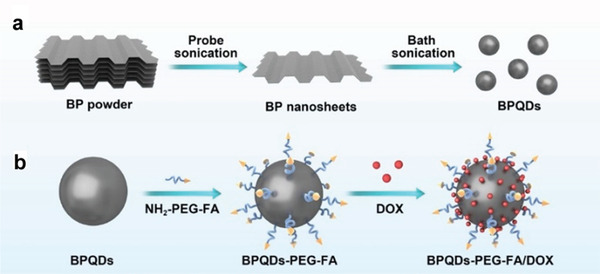
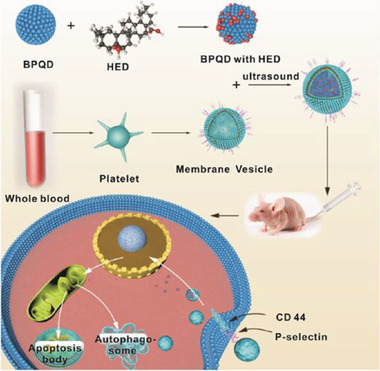
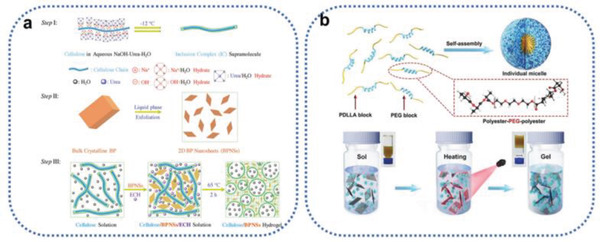
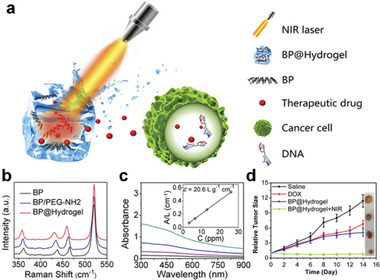
Cancer has been one of the major threats to the lives of human beings for centuries. Traditional therapy is more or less faced with certain defects, such as poor targeting, easy degradation, high side effects, etc. Therefore, in order to improve the treatment efficiency of drugs, an intelligent drug delivery system (DDS) is considered as a promising solution strategy. Due to their special structure and large specific surface area, 2D materials are considered to be a good platform for drug delivery. Black phosphorus (BP), as a new star of the 2D family, is recommended to have the potential to construct DDS by virtue of its outstanding photothermal therapy (PTT), photodynamic therapy (PDT), and biodegradable properties. This tutorial review is intended to provide an introduction of the current advances in BP-based DDSs for cancer therapy, which covers topics from its construction, classified by the types of platforms, to the stimuli-responsive controlled drug release. Moreover, their cancer therapy applications including mono-, bi-, and multi-modal synergistic cancer therapy as well as the research of biocompatibility are also discussed. Finally, the current status and future prospects of BP-based DDSs for cancer therapy are summarized.

Keywords: biocompatibility; black phosphorus; cancer therapy; drug delivery; stimuli‐responsive release.


Conflict of interest statement

The authors declare no conflict of interest.

Figures

Figure 1
Figure 1
Schematic diagram of the four types of platforms of the construction of BP‐based DDSs.
Figure 2
Figure 2
a) Schematic illustration for the fabrication of BPs@Au@Fe3O4 nanoplatform. b) The formation illustration of two important precursors. Reproduced with permission.[ 49 ] Copyright 2017, Wiley‐VCH.
Figure 3
Figure 3
Schematic representation of the PEGylated BP theranostic delivery platform. 1) PEG–NH2 (surface modification), 2) DOX (therapeutic agents), 3) Cy7–NH2 (NIR imaging agents), 4) FA–PEG–NH2 (targeting agents), 5) FITC–PEG–NH2 (fluorescent imaging agents). Reproduced with permission.[ 72 ] Copyright 2016, Wiley‐VCH.
Figure 4
Figure 4
Schematic illustration of the procedure used to fabricate nanostructures and the combined chemo/gene/photothermal targeted therapy of tumor cells. Reproduced with permission.[ 74 ] Copyright 2018, Wiley‐VCH.
Figure 5
Figure 5
Schematic depiction of preparing (BPQDs)–PEG–FA/DOX. a) Schematic illustration of the preparation of BPQDs. b) Schematic illustration of BPQD‐based drug delivery system. Reproduced with permission.[ 81 ] Copyright 2019, Molecular Diversity Preservation International.
Figure 6
Figure 6
Schematic diagram of PLT@BPQDs–HED construction and targeted therapeutic mechanisms. Reproduced with permission.[ 82 ] Copyright 2019, American Chemical Society.
Figure 7
Figure 7
a) Synthesis route of cellulose/BPNS composite hydrogels. Step I: Dissolution of cellulose with the aid of NaOH, urea, and H2O at a low temperature of −12 °C. Step II: Exfoliation of BPNSs by means of liquid‐phase exfoliation. Step III: Fabrication of BPNS‐integrated cellulose hydrogels. Reproduced with permission.[ 42 ] Copyright 2018, Wiley‐VCH. b) Schematic diagram of self‐assembly of PLEL into micelles and the thermogelation process of the BP@PLEL hydrogel induced by NIR irradiation. Reproduced with permission.[ 43 ] Copyright 2018, Wiley‐VCH.
Figure 8
Figure 8
a) Schematic diagram of the working principle of BP@Hydrogel. BP@Hydrogel released the encapsulated chemotherapeutics under NIR‐light irradiation to broken the DNA chains, leading to the apoptosis induction. b) Raman spectra of BPNSs. c) Absorbance spectra of BPNSs dispersed in IPA at different concentrations. Inset shows the normalized absorbance at concentrations of 3.25, 6.5, 13, and 26, respectively. d) Corresponding growth curves of tumors in different groups of mice treated with PBS solution, DOX, BP@Hydrogel depot only, and BP@Hydrogel depot with laser irradiation. The relative tumor volumes were normalized to their initial size. Inset shows representative photographs of tumors removed from the killed nude mice. Reproduced with permission.[ 92 ] Copyright 2018, PNAS.
Figure 9
Figure 9
a) Schematic diagram and drug release kinetics of BP–PEG/DOX NSs at pH = 7.4 and pH = 5.0 (in the absence or presence of 1.0 W cm−2 NIR laser). Reproduced with permission.[ 72 ] Copyright 2016, Wiley‐VCH. b) Schematic diagram and DOX released from BP‐DOX at pH 5.0 and 7.4 with or without 808 nm irradiation (1 W cm−2). Reproduced with permission.[ 41 ] Copyright 2016, Wiley‐VCH.
Figure 10
Figure 10
a) Percentages of active Cas9N3–sgRNA complexes released from Cas9N3–BPs at different time points. Time‐dependent degradation of b) bare BPs and c) Cas9N3–BPs in 10% FBS DMEM. d) Confocal laser scanning fluorescence imaging of MCF‐7 cells treated with Cas9N3A488–BPs at different time intervals. Blue and green fluorescence images show nuclear staining with DAPI and Alexa‐488, respectively (scale bar: 50 mm). e) Intracellular degradation of BPs in a selected cell monitored by Raman intensity mapping with the characteristic Ag 1 Raman peak of BP. Inset: the bright and nuclear (DAPI) image of a selected cell. The scale indicates 1.0 mm. f) Average intracellular Raman intensities of Cas9N3–BPs obtained from 120 × 120 points at different time intervals. Reproduced with permission.[ 56 ] Copyright 2018, Wiley‐VCH.
Figure 11
Figure 11
NIR‐light‐controlled BP@Hydrogel drug delivery platform. a) Schematic representation of the BP@Hydrogel drug delivery platform and the physical map shown in Inset. b) Absorbance spectra of released DOX. c) Photo‐controlled temperature increase and release of DOX from BP@Hydrogel depot. d) Rheological curves (blue line) and corresponding temperature curves (red line) of BP@Hydrogel with different BP concentrations under 1 W cm−2 NIR‐light irradiation. e) Release rate of DOX with and without laser exposure. f) Temperature change versus time under 808 nm laser with different powers. g) BP@Hydrogel under different laser exposures. h) Absorbance spectra of DOX under 808 nm laser exposure. Reproduced with permission.[ 92 ] Copyright 2018, PNAS.
Figure 12
Figure 12
a) Cumulative release profile of CR from PVA hydrogels and PVA/0.4pBP hydrogels in response to periodic laser switching. b) Schematic representation of release of CR from PVA/pBP composite hydrogels with and without NIR irradiation. Reproduced with permission.[ 94 ] Copyright 2018, The Royal Society of Chemistry.
Figure 13
Figure 13
a) Infrared thermal images of 4T1 tumor‐bearing mice irradiated with an 808 nm laser (2 W cm−2) for 2 min. b) Tumor growth curves indifferent groups subjected to different treatments. Data are presented as mean ± SD. c) Photographs of the 4T1 tumor‐bearing mice after laser irradiation. d) Photographs of tumors collected from different groups of mice at the end of the 18 day treatment. e) Micrographs of H&E stained tumor tissue obtained from different groups (group I: PBS + laser; group II: BP–Au NSs; group III: BP NSs + laser; group IV: BP–Au NSs + laser; scale bar: 200 µm). Reproduced with permission.[ 50 ] Copyright 2017, The Royal Society of Chemistry.
Figure 14
Figure 14
In vitro and in vivo genome editing and gene silencing of Cas9N3–BPs. a) Surveyor assays of MCF‐7 and hBMSCs cells treated with Cas9N3–BPs. b) Surveyor assays of RAW 264.7 cells treated with Cas9N3 via BPs delivery and Lipofectamine transfection. c) Surveyor assays of A549/EGFP cells treated with Cas9N3–BPs targeting EGFP. Controls: cells treated with only Cas9N3. d) Flow cytometry of A549/EGFP cells treated with BPs, Cas9N3, or Cas9N3–BPs. e) In vivo delivery of Cas9N3–BPs into A549/EGFP tumor‐bearing nude mice (scale bar: 100 mm). Reproduced with permission.[ 56 ] Copyright 2018, Wiley‐VCH.
Figure 15
Figure 15
Confocal images of HeLa cells incubated with a) free DOX, b) BPQDs–PEG/DOX, c) BPQDs–PEG–FA/DOX, and d) BPQDs–PEG–FA/DOX+free folic acid after incubation for 2 h. Relative viability of HeLa cells after treatment with DOX and different NPs for e) 24 and f) 48 h. Reproduced with permission.[ 81 ] Copyright 2019, Molecular Diversity Preservation International.
Figure 16
Figure 16
a) Photothermal heating curves of BP@PEG NSs (70 ppm), Ce6 (9 ppm), BP@PEG/Ce6 NSs (BP@PEG, 70 ppm), and PBS solutions under 660 nm laser irradiation (0.65 W cm−2, 10 min). b) Time‐dependent absorption spectra of BP@PEG/Ce6 NSs solution under 660 nm laser irradiation (0.45 W cm−2). c) Relative viabilities of HeLa cells after treated with BP@PEG NSs, Ce6, and BP@PEG/Ce6 NSs at different concentrations of BP@PEG NSs (1, 2.5, 5, 10, 25, and 50 ppm) or Ce6 (0.13, 0.325, 0.65, 1.3, 3.25, and 6.5 ppm) with irradiation (660 nm, 0.65 W cm−2, 10 min). d) Tumor growth curves of tumor‐bearing nude mice with various treatments (n = 4, mean ± SD, *P < 0.01). e) Photographs of tumors collected from the sacrificed mice. f) H&E stained histological images of major organs after 14 days treatment (scale bar, 100 µm). Reproduced with permission.[ 44 ] Copyright 2018, American Chemical Society.
Figure 17
Figure 17
a) Fluorescence images of 4T1 cells incubated with BP–DOX without or b) with 808 nm laser irradiation (0.8 W cm−2). c) The intracellular fluorescence was analyzed through flow cytometer. d) Fluorescence images of 4T1 cells treated with BP–PI without or e) with 808 nm irradiation (0.8 W cm−2). f) MTT assay of 4T1 cells under different treatments (scale bar = 50 µm). Reproduced with permission.[ 41 ] Copyright 2016, Wiley‐VCH.
Figure 18
Figure 18
a) The TNF‐α and IL‐6 secretion of macrophages treated by PBS (negative control) and lipopolysaccharides (LPS) (positive control) was set as 0% and 100%, respectively. Data are mean ± SD (n = 3). * p < 0.05 versus LPS. ** p < 0.01 versus LPS. b) The western blotting and c) semiquantitative analysis of Bax and Bcl‐2 expression in Hela cells treated with different scheme as above for 24 h. Data are mean ± SD (n = 3). ** p < 0.01 versus control. ## p < 0.01. Reproduced with permission.[ 48 ] Copyright 2019, Informa UK Limited.
Figure 19
Figure 19
Morphology images of RBCs incubated with BPNs–PDA–PEG–PEITC at concentrations of a–f) 0 (negative control), 100, 200, 400, 800, and 1600 µg mL−1. g–j) Hemolysis, activated partial thromboplastin time (APTT), prothrombin time (PT), thrombin time (TT) assays of BPNs–PDA–PEG–PEITC with different concentrations. Reproduced with permission.[ 67 ] Copyright 2019, Elsevier Ltd.
Figure 20
Figure 20
Toxicity assays. a) In vitro toxicity assays. Relative cell viability of B16, SMMC‐7721, and J774A.1 cells after incubation with Mock (no treatment) and hydrogels without BPNSs or with BPNS concentrations of 95, 190, 285, and 380 ppm for 24 h. b) Body weight was monitored on days 1, 3, 5, 7, 9, 11, 13, and 15. c) Hematoxylin and eosin (H&E) staining of the heart, liver, spleen, lung, and kidney on day 15. d) Immunotoxicity assays in vivo for protein levels of TNF‐α, IL‐1β, and IL‐6 in the serum of C57BL/6 mice after indicated treatments. Data were shown as mean ± SD, Student's t‐test, n = 5, n.s. means p > 0.05, nonsignificant. Reproduced with permission.[ 42 ] Copyright 2018, Wiley‐VCH.

Similar articles

Cited by

References

    1. Keca J., Chen J., Overchuk M., Muhanna N., Maclaughlin C., Jin C., Foltz W., Irish J., Zheng G., Angew. Chem., Int. Ed. 2016, 55, 6187. - PubMed
    1. Zhang K., Chen H., Guo X., Zhang D., Zheng Y., Zheng H., Shi J., Sci. Rep. 2015, 5, 8766. - PMC - PubMed
    1. Huynh E., Leung B., Helfield B., Shakiba M., Gandier J., Jin C., Master E., Wilson B., Goertz D., Zheng G., Nat. Nanotechnol. 2015, 10, 325. - PubMed
    1. Lee N., Choi S., Hyeon T., Adv. Mater. 2013, 25, 2641. - PubMed
    1. Liu Y., Ai K., Liu J., Yuan Q., He Y., Lu L., Angew. Chem., Int. Ed. 2012, 51, 1437. - PubMed

LinkOut - more resources