Review
. 2021 Jan 21;8(5):2003143.
doi: 10.1002/advs.202003143. eCollection 2021 Mar.

Metal-Organic Frameworks for Liquid Phase Applications

Affiliations
Review

Metal-Organic Frameworks for Liquid Phase Applications

Anjaiah Nalaparaju et al. Adv Sci (Weinh). .

Abstract

In the last two decades, metal-organic frameworks (MOFs) have attracted overwhelming attention. With readily tunable structures and functionalities, MOFs offer an unprecedentedly vast degree of design flexibility from enormous number of inorganic and organic building blocks or via postsynthetic modification to produce functional nanoporous materials. A large extent of experimental and computational studies of MOFs have been focused on gas phase applications, particularly the storage of low-carbon footprint energy carriers and the separation of CO2-containing gas mixtures. With progressive success in the synthesis of water- and solvent-resistant MOFs over the past several years, the increasingly active exploration of MOFs has been witnessed for widespread liquid phase applications such as liquid fuel purification, aromatics separation, water treatment, solvent recovery, chemical sensing, chiral separation, drug delivery, biomolecule encapsulation and separation. At this juncture, the recent experimental and computational studies are summarized herein for these multifaceted liquid phase applications to demonstrate the rapid advance in this burgeoning field. The challenges and opportunities moving from laboratory scale towards practical applications are discussed.

Keywords: computations; liquid phase applications; metal−organic frameworks; nanoporous materials.


Conflict of interest statement

The authors declare no conflict of interest.

Figures

Figure 1
Figure 1
Percentage of papers presented at MOF conferences: MOF‐2010 (Marseille, France), MOF‐2012 (Edinburgh, UK), MOF‐2014 (Kobe, Japan), MOF‐2016 (California, USA), and MOF‐2018 (Auckland, New Zealand).
Figure 2
Figure 2
Liquid phase applications of MOFs.
Figure 3
Figure 3
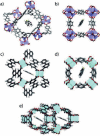
Locations of a DBT molecule in a) MOF‐177, b) MOF‐5, c) UMCM‐150, d) HKUST‐1, and e) MOF‐505. Reproduced with permission.[ 23 ] Copyright 2008, American Chemical Society.
Figure 4
Figure 4
a) Schematic of N‐compounds adsorption in pANI‐loaded MIL‐101, b) adsorption isotherms of indole in MIL‐101 and P‐pANI‐5. Reproduced with permission.[ 41 ] Copyright 2018, American Chemical Society.
Figure 5
Figure 5
Flow scheme for the separation of C5‐cut from a steam cracker. Reproduced with permission.[ 51 ] Copyright 2010, American Chemical Society.
Figure 6
Figure 6
a) Thiophene sieving mechanism, b) pervaporative desulfurization performance of Pebax‐Ag+@NH2‐MIL‐1.0/polysulfone hybrid membrane and other membranes. Reproduced with permission.[ 60 ] Copyright 2019, American Chemical Society.
Figure 7
Figure 7
a,b) Typical result of a liquid breakthrough measurement using a binary feed containing DMF (green) and butanol (blue). Red: ZIF‐8. Green: ZIF‐71. Black: UiO‐66. Blue: FA‐UiO‐66. The solid curves represent IAST predictions. c,d) SMB and simulated liquid composition profiles along the axial position coordinate using ZIF‐8 and multicomponent Langmuir adsorption model. Reproduced with permission.[ 65 ] Copyright 2019, American Chemical Society.
Figure 8
Figure 8
Reactive seeding method to prepare MIL‐53 membrane on an alumina support. Reproduced with permission.[ 71 ] Copyright 2011, Royal Society of Chemistry.
Figure 9
Figure 9
Permselectivities for water/ethanol mixtures in Na‐rho‐ZMOF and Zn4O(bdc)(bpz)2. Reproduced with permission.[ 77 ] Copyright 2011, Royal Society of Chemistry.
Figure 10
Figure 10
a) Ethylbenzene (EB)/styrene (St) separation on Cu3(BTC)2. b) breakthrough elution profiles of EB and St. Reproduced with permission.[ 89 ] Copyright 2011, American Chemical Society.
Figure 11
Figure 11
HPLC chromatograms on MIL‐101 slurry‐packed column for the separation of a) xylenes and ethylbenzene b) dichlorobenzenes. Reproduced with permission.[ 98 ] Copyright 2011, American Chemical Society.
Figure 12
Figure 12
(Top) Zn2(BDC)2DABCO membrane preparation by a secondary growth approach. (Bottom) Cross‐section SEM image and EDS map of Zn2(BDC)2DABCO membrane grown after four cycles. Reproduced with permission.[ 115 ] Copyright 2013, Elsevier.
Figure 13
Figure 13
Toluene/n‐heptane separation through a) MOP/W3000, b) Cu3(BTC)2/PVA hybrid membranes. a) Reproduced with permission.[ 118 ] Copyright 2014, Royal Society of Chemistry. b) Reproduced with permission.[ 119 ] Copyright 2015, Elsevier.
Figure 14
Figure 14
a) Transport velocities of xylene isomers versus external force. b) Interaction energies of xylene isomers with MIL‐101 and hexane, respectively. Reproduced with permission.[ 128 ] Copyright 2013, American Chemical Society.
Figure 15
Figure 15
a) Schematic representation of the separation of p‐xylene from o‐xylene and m‐xylene through MIL‐160 membrane. b) Simulation snapshot of p‐xylene (green) and o‐xylene (yellow) adsorbed in MIL‐160 at 75 °C and 10 kPa, showing an enrichment of p‐xylene over o‐xylene due to the stronger interaction between p‐xylene and MIL‐160. Reproduced with permission.[ 132 ] Copyright 2018, Wiley‐VCH.
Figure 16
Figure 16
Percentages of adsorbed metal ions and exchanged Zn2+ ions by Zn(4,4’‐bpy)2‐(FcphSO3)2 from the solutions at different concentrations of Mn2+, Co2+, Ni2+, Cu2+, Zn2+, Cd2+, and Pb2+. The red, orange, and yellow columns represent the percentages of exchanged Zn2+ ions from solutions at 10, 100, and 1000 µg mL−1, respectively, whereas the brown, blue, and cyan columns represent the percentages of adsorbed metal ions from solution at 10, 100, and 1000 µg mL−1, respectively. Reproduced with permission.[ 135 ] Copyright 2008, Wiley‐VCH.
Figure 17
Figure 17
Pores with imine and amide groups in a) TMU‐6, b) TMU‐21, c) TMU‐23, and d) TMU‐24. Reproduced with permission.[ 163 ] Copyright 2018, Royal Society of Chemistry.
Figure 18
Figure 18
Adsorption of xylenol organe (represented by R‐SO3 ) in MIL‐101. Reproduced with permission.[ 187 ] Copyright 2012, Elsevier.
Figure 19
Figure 19
a) Water desalination through a ZIF‐8 membrane. Two chambers (aqueous solution with 0.5 M NaCl on the left and pure water bath on the right) were separated by a ZIF‐8 membrane. ZIF‐8, yellow; Na+, blue; Cl, gray; H of H2O, white; O of H2O, magenta (left chamber), and green (right chamber). b) Number of net transferred water molecules from NaCl solution to pure water bath. Reproduced with permission.[ 205 ] Copyright 2011, American Institute of Physics.
Figure 20
Figure 20
Removal of Pb2+ by ion exchange in Na‐rho‐ZMOF at 0, 0.2, and 2 ns, respectively. Pb2+: orange; Cl: green; Na+: blue. Reproduced with permission.[ 210 ] Copyright 2012, American Chemical Society.
Figure 21
Figure 21
Binding energies of anions onto a) one Zr site and b) two Zr sites. c) Binding modes and reduction pathways of anions in UiO‐66‐NH2. Reproduced with permission.[ 214 ] Copyright 2017, Royal Society of Chemistry.
Figure 22
Figure 22
Schematic in situ growth of MMMs. Reproduced with permission.[ 218 ] Copyright 2014, Royal Society of Chemistry.
Figure 23
Figure 23
a) Conventional PA membrane. b) UiO‐66/PA TFN membrane. c) Comparison of separation performance with other nanofiltration membranes. Reproduced with permission.[ 230 ] Copyright 2017, American Chemical Society.
Figure 24
Figure 24
(1) Cross‐linked asymmetric polyimide (P84) support (2) Langmuir–Schaefer (LS)‐MIL‐101(Cr) monolayer (3) polyamide selective layer and (4) polyamide layer with MIL‐101(Cr) nanoparticles (NPs) inside. Reproduced with permission.[ 235 ] Copyright 2018, American Chemical Society.
Figure 25
Figure 25
Cross‐sectional FE‐SEM images of a) MIL‐53(Al) and b) NH2‐MIL‐53(Al) membranes on an α‐alumina support. c) Methanol and isopropanol permeability. Reproduced with permission.[ 240 ] Copyright 2019, Royal Society of Chemistry.
Figure 26
Figure 26
Solvent fluxes through ZIF‐25, ZIF‐71, and ZIF‐96. Correlations between permeances and a combination of solvent properties in ZIF‐25 and ZIF‐71. Reproduced with permission.[ 242 ] Copyright 2018, American Chemical Society.
Figure 27
Figure 27
Solute rejection in seven solvents by TpPa‐X membranes (TpPa‐AM3, –AMCOOH, –OBn, –AMC2NH2, –OC4H9, –OC3OH). Reproduced with permission.[ 243 ] Copyright 2019, American Chemical Society.
Figure 28
Figure 28
a) Synthesis of UiO‐68‐NCS, UiO‐68‐R6G and UiO‐68‐R6G’. b,c) bright field; d,e) dark‐field; f,g) overlaid images of a 3‐day‐old zebrafish treated with nanosized UiO‐68‐R6G. Reproduced with permission.[ 260 ] Copyright 2019, Royal Society of Chemistry.
Figure 29
Figure 29
JLU‐MOF50: a–d) topology simplification of V‐shaped ligand and Zr6 cluster, polyhedron and space filling representation; e) Luminescence intensity of JLU‐MOF50 after treated in aqueous solutions with different pH values and different anions. Reproduced with permission.[ 293 ] Copyright 2018, Royal Society of Chemistry.
Figure 30
Figure 30
a) Pendant amine functionality for fluorescence. b) Comparison of fluorescence quenching efficiency of different nitro analytes toward activated UiO‐68@NH2 in water. Reproduced with permission.[ 300 ] Copyright 2015, Royal Society of Chemistry.
Figure 31
Figure 31
a) Encapsulation of TMPyPE into bio‐MOF‐1. Colors b) before and c) after encapsulation. Reproduced with permission.[ 308 ] Copyright 2019, Royal Society of Chemistry.
Figure 32
Figure 32
HOMO–LUMO energy profiles of 1‐PEA, 1‐PPA, (R)‐1, (R)‐2, and (R)‐3. Reproduced with permission.[ 351 ] Copyright 2017, American Chemical Society.
Figure 33
Figure 33
Relative fluorescence intensity of bulk and nanosheets of NUS‐24 in various VOC solutions. The error bars show average and range of measured values based on at least five repeats in every single measurement. Reproduced with permission.[ 352 ] Copyright 2017, Springer Nature.
Figure 34
Figure 34
a) HOMO and LUMO energy levels of 4,4′‐bimbp and pta2−. b) PET process and turn‐on sensing of Fe3+. Reproduced with permission.[ 355 ] Copyright 2019, Royal Society of Chemistry.
Figure 35
Figure 35
Locations of R‐PhEtOH and S‐PhEtOH in Zn2(bdc)(S‐lac)(dmf). Reproduced with permission.[ 370 ] Copyright 2012, Royal Society of Chemistry.
Figure 36
Figure 36
a) A single helical chain in ([ZnLBr]·H2O)n. b) Top view of a single helical chain. c) Space‐filling diagram of ([ZnLBr]·H2O)n network. Reproduced with permission.[ 384 ] Copyright 2014, American Chemical Society.
Figure 37
Figure 37
a) A homochiral MOF membrane preparation by in situ growth on a nickel net. b) ee values for racemic diol mixtures. Reproduced with permission.[ 391 ] Copyright 2013, Royal Society of Chemistry.
Figure 38
Figure 38
a) Homochiral MOF membrane for the separation of racemic MPS mixture. b) R‐/S‐MPS concentrations on the permeate side (the inset indicates simulation results). Reproduced with permission.[ 397 ] Copyright 2012, Royal Society of Chemistry.
Figure 39
Figure 39
a) Separation of racemic amines in HPLC. b,c) Binding sites of (R)‐2‐butylamine and (S)‐2‐butylamine in the host. Reproduced with permission.[ 401 ] Copyright 2014, Springer Nature.
Figure 40
Figure 40
X‐ray crystal structures of a) 6(S)‐2‐butanol·6H2O, b) hexamer of six (S)‐2‐butanol, d) 6(S)‐2‐butylamine·9H2O, e) (S)‐2‐butylamine with water molecules in a slipped parallel conformation in the chiral pocket. The side view of c) 6(S)‐2‐butanol·6H2O and f) 6(S)‐2‐butylamine·9H2O in the chiral pocket. Adsorption isotherms of racemic mixtures: g) (S)‐/(R)‐2‐butanol h) (S)‐/(R)‐2‐butylamine from simulation. Reproduced with permission.[ 351 ] Copyright 2017, American Chemical Society.
Figure 41
Figure 41
a) Fourier transform infrared spectroscopy of MIL‐53 and ibuprofen. b) Optimized arrangement of ibuprofen in MIL‐53. Fe: blue, O: red, C: gray, H: white. Reproduced with permission.[ 404 ] Copyright 2008, American Chemical Society.
Figure 42
Figure 42
Cation‐triggered procainamide release from bio‐MOF‐1. Reproduced with permission.[ 426 ] Copyright 2009, American Chemical Society.
Figure 43
Figure 43
(Bottom) Preparation of CD‐MOF/PAA composite microspheres. (Top) Structural formulae for ibuprofen, lansoprazole and γ‐cyclodextrin and CD‐MOF. Reproduced with permission.[ 455 ] Copyright 2017, Royal Society of Chemistry.
Figure 44
Figure 44
Optimized conformations of ibuprofen in a) MIL‐101 and b) UMCM‐1. The dotted line: a coordination bond between ibuprofen and the Cr site in MIL‐101. Reproduced with permission.[ 468 ] Copyright 2009, American Chemical Society.
Figure 45
Figure 45
a) Organic linkers in MOF‐74 structures. b) MTX and c) 5‐FU loadings in MOF‐74. Reproduced with permission.[ 475 ] Copyright 2017, Royal Society of Chemistry.
Figure 46
Figure 46
a) 32 wt% GEM loading. Optimized geometries of GEM in b) OH‐IRMOF‐74‐III and c) IRMOF‐74‐III. MOF: C, gray; Mg, green; O, red; H, white. GEM: C, cyan; O, red; N, blue; H, white; F, light blue. Reproduced with permission.[ 476 ] Copyright 2017, Royal Society of Chemistry.
Figure 47
Figure 47
Encapsulation of a) myoglobin and b) green fluorescent protein in IRMOF‐74s. Reproduced with permission.[ 487 ] Copyright 2012, American Association for the Advancement of Science.
Figure 48
Figure 48
Using MOF encapsulation for biospecimen preservation. Reproduced with permission.[ 502 ] Copyright 2018, American Chemical Society.
Figure 49
Figure 49
a) Synthesis of DZMOF. b) Enrichment of phosphopeptides from a biological sample. Reproduced with permission.[ 526 ] Copyright 2016, American Chemical Society.
Figure 50
Figure 50
a) Separation of amino acids (Arg, Phe, and Trp) from aqueous solution by MIL‐101. b) Interaction energies of amino acids with MIL‐101 and water, respectively. Reproduced with permission.[ 128 ] Copyright 2013, American Chemical Society.
Figure 51
Figure 51
Structural evolution of six peptide chains of β‐adrenoceptor in a) IRMOF‐74‐II and b) IRMOF‐74‐III at 290 K. Reproduced with permission.[ 531 ] Copyright 2016, Elsevier.
Figure 52
Figure 52
a–d) Equilibrated structures of Trp‐cage in IRMOF‐74‐Vs. e) Order parameters of α‐helix in Trp‐cage and f) distance between two ends of secondary structure in Trp‐cage versus temperature. Reproduced with permission.[ 532 ] Copyright 2016, American Chemical Society.
Figure 53
Figure 53
Challenges and opportunities of MOFs for liquid phase applications.

Similar articles

Cited by

References

    1. Ishizaki K., Komarneni S., Nanko M., Porous Materials, Springer, Boston, MA: 1998.
    1. Baerlocher C., McCusker L. B., Database of Zeolite Structures , http://www.iza-structure.org/databases/
    1. Furukawa H., Cordova K. E., O'Keeffe M., Yaghi O. M., Science 2013, 341, 1230444. - PubMed
    1. https://www.ccdc.cam.ac.uk/ (accessed: August 2020).
    1. Ferey G., Chem. Soc. Rev. 2008, 37, 191. - PubMed

LinkOut - more resources