. 2021 Feb 19:12:e00168.
doi: 10.1016/j.mec.2021.e00168. eCollection 2021 Jun.

Development of antisense RNA-mediated quantifiable inhibition for metabolic regulation

Affiliations

Development of antisense RNA-mediated quantifiable inhibition for metabolic regulation

Ruihua Zhang et al. Metab Eng Commun. .

Abstract

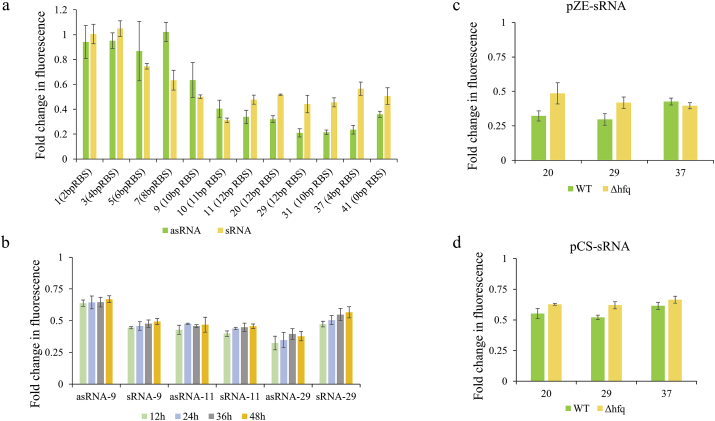
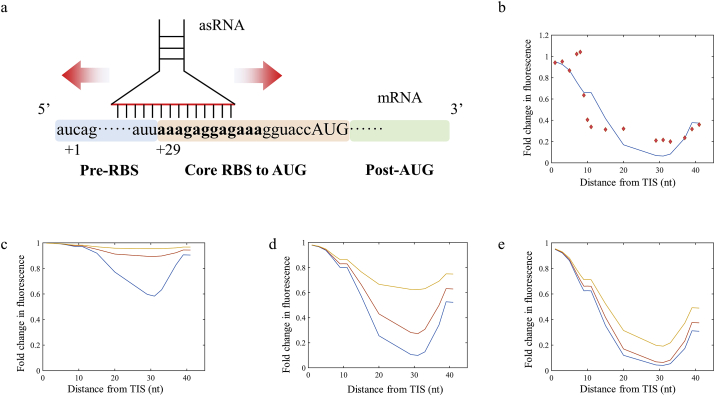
Trans-regulating elements such as noncoding RNAs are crucial in modifying cells, and has shown broad application in synthetic biology, metabolic engineering and RNA therapies. Although effective, titration of the regulatory levels of such elements is less explored. Encouraged by the need of fine-tuning cellular functions, we studied key parameters of the antisense RNA design including oligonucleotide length, targeting region and relative dosage to achieve differentiated inhibition. We determined a 30-nucleotide configuration that renders efficient and robust inhibition. We found that by targeting the core RBS region proportionally, quantifiable inhibition levels can be rationally obtained. A mathematic model was established accordingly with refined energy terms and successfully validated by depicting the inhibition levels for genomic targets. Additionally, we applied this fine-tuning approach for 4-hydroxycoumarin biosynthesis by simultaneous and quantifiable knockdown of multiple targets, resulting in a 3.58-fold increase in titer of the engineered strain comparing to that of the non-regulated. We believe the developed tool is broadly compatible and provides an extra layer of control in modifying living systems.

Keywords: 4-Hydroxycoumarin; Antisense RNA; Core RBS region; Fine-tuning; Quantifiable inhibition.


Conflict of interest statement

The authors claim no conflict of interest.

Figures

Fig. 1
Fig. 1
Inhibition test of asRNAs on egfp expression from TIS or RBS with varied lengths. (a) Sequence layout of mRNA and asRNA targeting sequences. Arrows are demonstrative examples of asRNA targeting positions. (b) Inhibition results of asRNA from TIS (brown). (c) Inhibition results of asRNA from RBS (blue). Light bars indicate results for inhibition pSA-based expression (low copy number), dark bars for pCS-based expression (medium copy number). Y-axis indicates fold change of normalized fluorescence intensity comparing to the control. X-axis showed the targeting lengths of the asRNAs. (For interpretation of the references to colour in this figure legend, the reader is referred to the Web version of this article.)
Fig. 2
Fig. 2
Inhibition test of 30-nt asRNAs mapping from TIS or RBS. (a) Design scheme of asRNA walking. Arrows are demonstrative examples of asRNA targeting positions. (b) Inhibition rates related asRNA targeting regions. X-axis shows relative distance between TIS and asRNA start (numbers within parentheses indicate the length of core RBS covered). (c) Inhibition of asRNAs targeting sites within egfp gene. Dark green indicates high-expressed gene on pZE12-luc, green indicates medium-expressed gene on pCS27, light green indicates low-expressed gene on pSA74. Site 1a and 1b, 2a and 2b, and 3a and 3b are nearby regions, respectively. While 1b, 2b and 3b were prone to form secondary structures. The targeted sequences within GFP are annotated in the supplementary file. (For interpretation of the references to colour in this figure legend, the reader is referred to the Web version of this article.)
Fig. 3
Fig. 3
Comparison of inhibition performance between asRNAs and sRNAs. (a) Comparison of inhibition between asRNA- and sRNA-based regulations on varied positions across 5′ UTR. X-axis shows relative distance between TIS and asRNA/sRNA start (numbers within parentheses indicate the length of core RBS covered). (b) Comparison of inhibition between asRNA- and sRNA-based regulations on the high-copy number plasmid at representative target sites over 48 ​h. (c) and (d) sRNA inhibition test in wild type (E. coli BW25113) and the corresponding hfq knockout strain.
Fig. 4
Fig. 4
The mathematic model for quantifiable asRNA inhibition. (a) Scheme of the proposed mechanism. (b) Plotting of experimental data with simulated inhibition levels for plasmid-originated RBS. Red diamonds indicate data points, blue lines indicate simulated results. (c)–(e) Simulated results for dosage effect. Blue, red, and yellow lines indicate targeted genes on low-, medium, or high-copy number plasmids, respectively. (c) Low copy number of asRNAs. (d) Medium copy number of asRNAs. (e) High copy number of asRNAs. (b)–(e) X-axis shows the relative distance between TIS and start of asRNA sequence. Y-axis shows fold change of reporting signal based on nonregulated control. (For interpretation of the references to colour in this figure legend, the reader is referred to the Web version of this article.)
Fig. 5
Fig. 5
Targeting 5′ UTR from genomic targets using quantifiable asRNAs. (a) Sequences of extracted 5′ UTR for fabD and ydiI. The underlining nucleotides are identified translation-relevant sequence by the RBS calculator Version 2.1. Yellow-highlighted nucleotides are assumed core RBS. The brown arrows under each 5′ UTR sequence are demonstrated asRNAs, with relative distance to TIS displayed. (b) Plotting of experimental data with simulated inhibition levels for asRNAs targeting pCS-fabD-GFP. (c) Plotting of experimental data with simulated inhibition levels for asRNAs targeting pCS-ydiI-GFP. (b)–(c) X-axis shows the relative distance between TIS and start of asRNA sequence. Y-axis shows fold change of reporting signal based on nonregulated control. (For interpretation of the references to colour in this figure legend, the reader is referred to the Web version of this article.)
Fig. 6
Fig. 6
Biosynthesis of 4-HC by multiplex inhibition of genomic targets by quantifiable asRNAs. (a) The biosynthesis pathway of 4-HC from glycolysis and the pentose phosphate pathway (PPP). Only overexpressed or regulated enzymatic steps are labeled. FabD and YdiI are enzymes encoded by the genes subjecting to asRNA-mediated regulation. (b) Specific and potential off-target inhibition by the quantifiable asRNAs on the genomic targets. (c) Results of 4-HC titer from pCS-EPPS and asRNAs on high level. Z-axis shows 4-HC titer after 24 ​h. X- and Y-axis show the corresponding asRNA plasmids used in the strains. 0 means strains transformed with the plasmid with nonsense asRNA control.

References

    1. Aiba H. Mechanism of RNA silencing by Hfq-binding small RNAs. Curr. Opin. Microbiol. 2007;10:134–139. - PubMed
    1. Baba T., Ara T., Hasegawa M., Takai Y., Okumura Y., Baba M., Datsenko K.A., Tomita M., Wanner B.L., Mori H. Construction of Escherichia coli K-12 in-frame, single-gene knockout mutants: the Keio collection. Mol. Syst. Biol. 2006;2 2006-0008. - PMC - PubMed
    1. Bailey J.E. Toward a science of metabolic engineering. Science. 1991;252:1668–1675. - PubMed
    1. Bremer H., Dennis P.P. American Society for Microbiology. Chapter, Modulation of chemical composition and other parameters of the cell by growth rate; Washington (DC): 1996. Escherichia coli and Salmonella: Cellular and Molecular Biology; pp. 1553–1569.
    1. Chen J.L., Dishler A.L., Kennedy S.D., Yildirim I., Liu B., Turner D.H., Serra M.J. Testing the nearest neighbor model for canonical RNA base pairs: revision of GU parameters. Biochemistry. 2012;51:3508–3522. - PMC - PubMed

LinkOut - more resources