

m6A RNA methylation regulators play an important role in the prognosis of patients with testicular germ cell tumor
- PMID: 33718069
- PMCID: PMC7947426
- DOI: 10.21037/tau-20-963
m6A RNA methylation regulators play an important role in the prognosis of patients with testicular germ cell tumor
Abstract
Background: N6-methyladenosine (m6A) is found to be associated with promoting tumorigenesis in different types of cancers, however, the function of m6A-related genes in testicular germ cell tumors (TGCT) development remains to be illuminated. This study aimed to investigated the prognostic value of m6A RNA methylation regulators in TGCT.
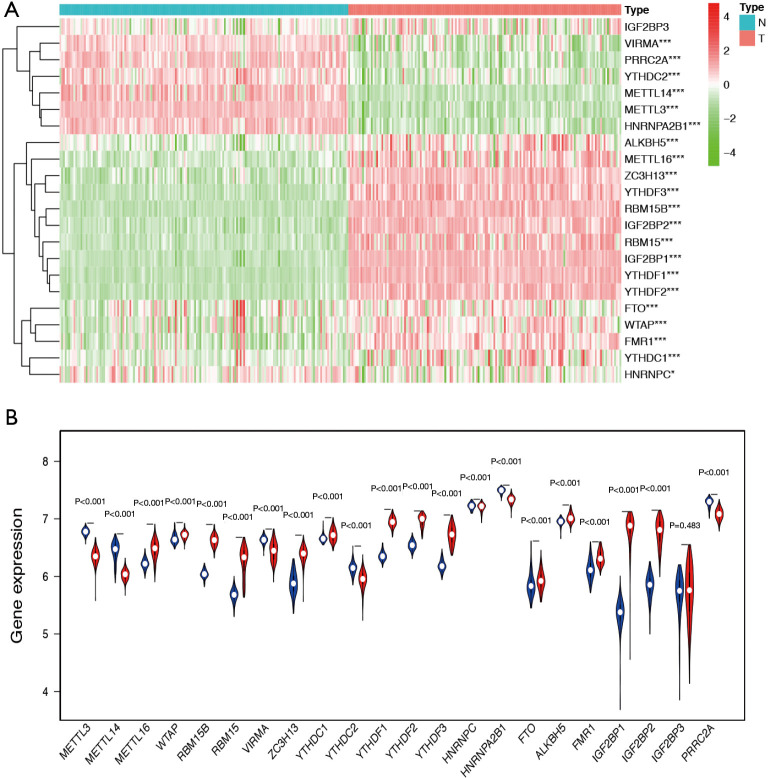
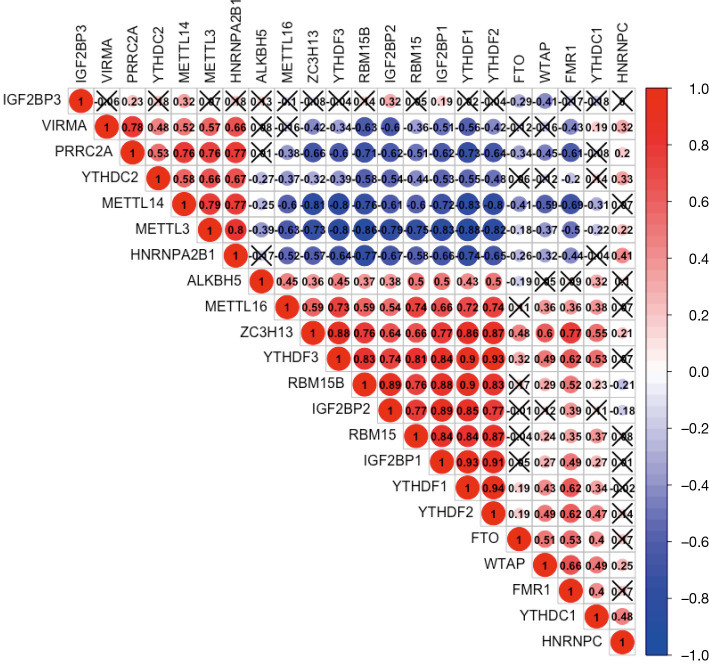
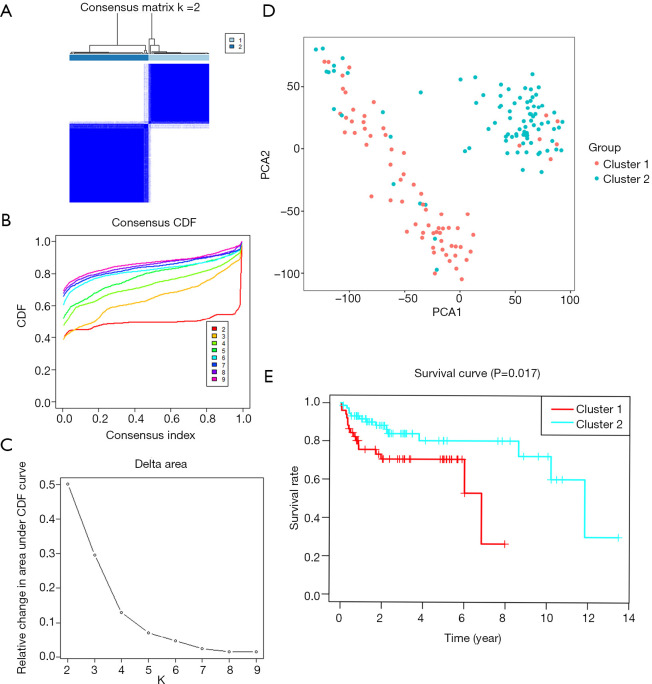
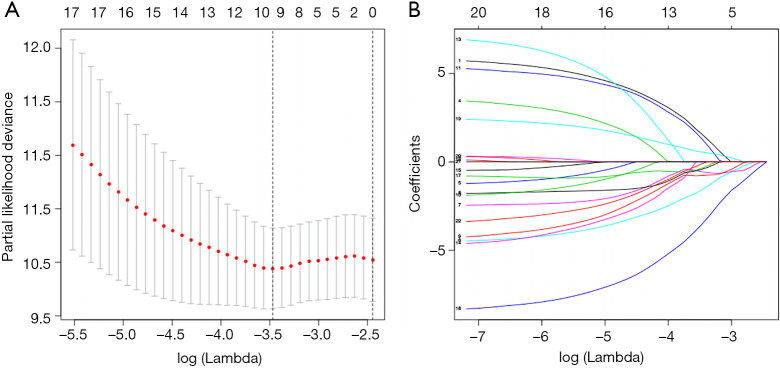
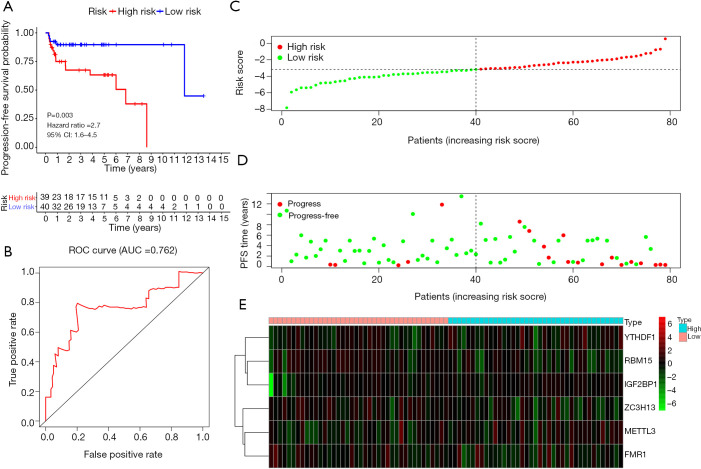
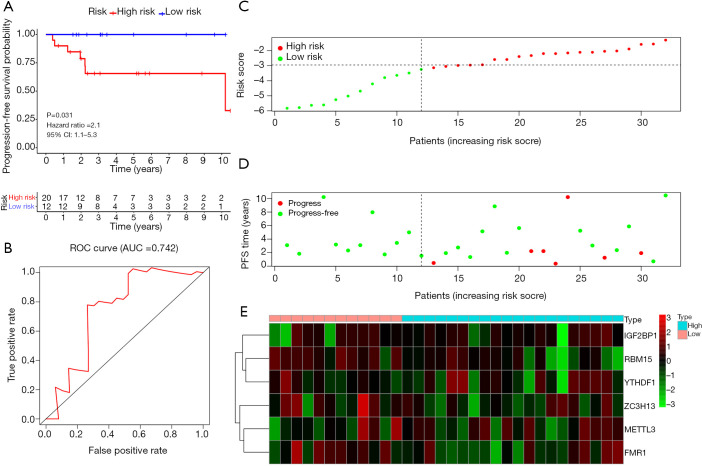
Methods: We collected TGCT patients' information about clinicopathologic parameters and twenty-two m6A regulatory genes expression from The Cancer Genome Atlas (TCGA) database and Genotype-Tissue Expression (GTEx). We analyzed the differentially expressed m6A RNA methylation regulators between tumor tissues and normal tissues, as well as the correlation of m6A RNA methylation regulators. By using Cox univariate analysis, last absolute shrinkage and selection operator (LASSO) Cox regression algorithm and Cox multivariate proportional hazards regression analysis, a risk score was constructed based on a TCGA training cohort, and further verified in the TCGA testing cohort. Then, univariate and multivariate Cox regression analyses were used to evaluate the relationship between risk score and progression-free survival (PFS) in TGCT. Finally, the six-gene risk score was further verified by two gene expression profiles (GSE3218 and GSE10783) as an independent external validation cohort.
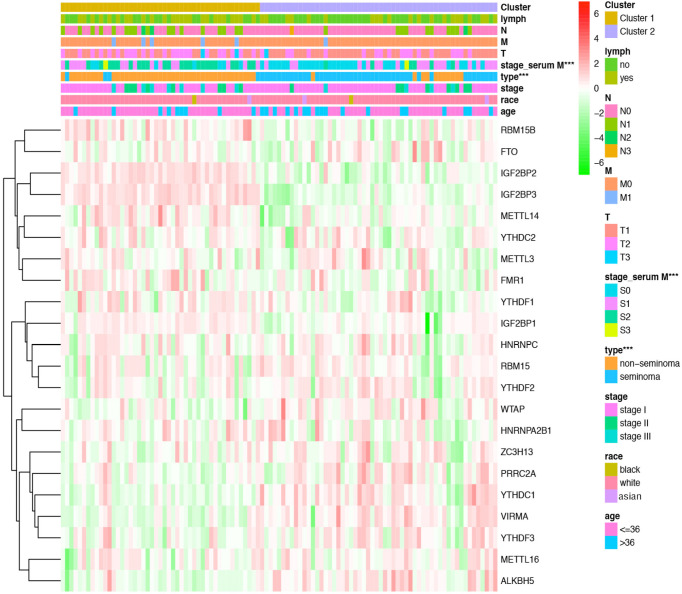
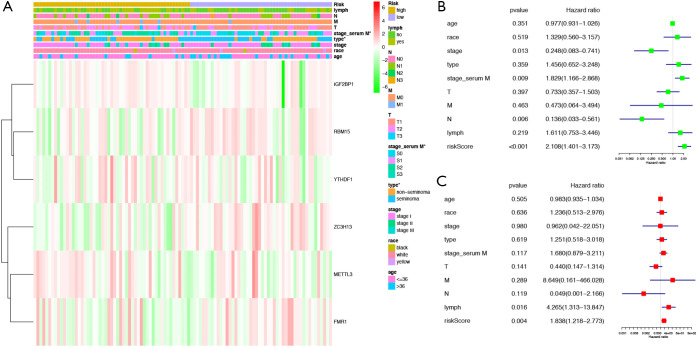
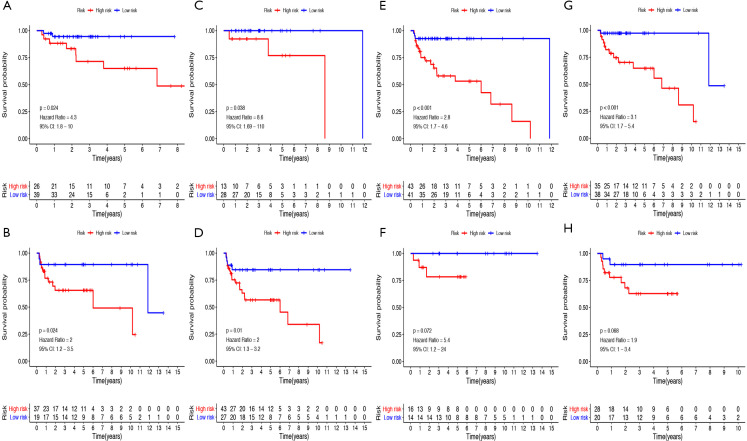
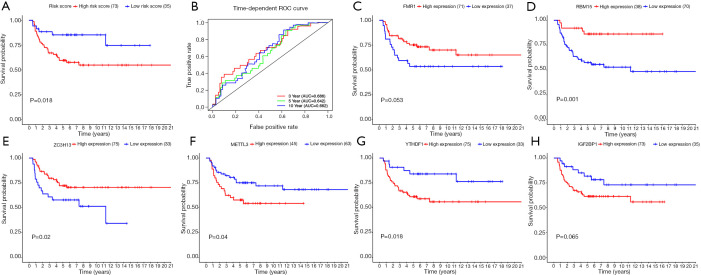
Results: Distinct expression patterns of m6A regulatory genes were identified between TGCT tissues and normal tissues in TCGA and GTEx datasets. To predict prognosis of TGCT patients, a risk score was calculated based on six selected m6A RNA methylation regulators (YTHDF1, RBM15, IGF2BP1, ZC3H13, METTL3, and FMR1). Additionally, we found significant differences between the high-risk and low-risk groups in serum marker study levels and histologic subtype. Univariate and multivariate analysis indicated that high risk score was associated with unfavorable PFS. Ultimately, the risk score was further verified by two gene expression profiles (GSE3218 and GSE10783).
Conclusions: Based on six selected m6A RNA methylation regulators, we developed a m6A methylation related risk score that can independently predict the prognosis of TGCT patients, and verify the prediction efficiency in TCGA and GEO datasets. Patients in high-risk group were associated with serum tumor marker study levels beyond the normal limits, non-seminoma, and unfavorable survival time. However, further prospective experiments should be carried out to verify our results.
Keywords: N6-methyladenosine (m6A); Testicular germ cell tumors (TGCT); m6A RNA methylation; prognosis; risk score.
2021 Translational Andrology and Urology. All rights reserved.
Conflict of interest statement
Conflicts of Interest: All authors have completed the ICMJE uniform disclosure form (available at http://dx.doi.org/10.21037/tau-20-963). The authors have no conflicts of interest to declare.
Figures
Similar articles
-
Contributions and Prognostic Values of N6-Methyladenosine RNA Methylation Regulators in Hepatocellular Carcinoma.Front Genet. 2021 Jan 15;11:614566. doi: 10.3389/fgene.2020.614566. eCollection 2020. Front Genet. 2021. PMID: 33519919 Free PMC article.
-
Comprehensive Analysis of PD-L1 Expression, Immune Infiltrates, and m6A RNA Methylation Regulators in Esophageal Squamous Cell Carcinoma.Front Immunol. 2021 May 12;12:669750. doi: 10.3389/fimmu.2021.669750. eCollection 2021. Front Immunol. 2021. PMID: 34054840 Free PMC article.
-
RNA-Binding Proteins Play an Important Role in the Prognosis of Patients With Testicular Germ Cell Tumor.Front Genet. 2021 Mar 11;12:610291. doi: 10.3389/fgene.2021.610291. eCollection 2021. Front Genet. 2021. PMID: 33777092 Free PMC article.
-
Effect of N6-methyladenosine methylation-related gene signature for predicting the prognosis of hepatocellular carcinoma patients.Front Surg. 2023 Mar 3;10:1052100. doi: 10.3389/fsurg.2023.1052100. eCollection 2023. Front Surg. 2023. PMID: 36936652 Free PMC article. Review.
-
Function and clinical significance of N6-methyladenosine in digestive system tumours.Exp Hematol Oncol. 2021 Jul 10;10(1):40. doi: 10.1186/s40164-021-00234-1. Exp Hematol Oncol. 2021. PMID: 34246319 Free PMC article. Review.
Cited by
-
RNA Binding Motif Protein 15 (RBM15): Structure, Function and Its Research Progress in Tumors.Int J Gen Med. 2025 Jul 4;18:3635-3649. doi: 10.2147/IJGM.S519741. eCollection 2025. Int J Gen Med. 2025. PMID: 40636291 Free PMC article. Review.
-
Breaking the Mold: Epigenetics and Genomics Approaches Addressing Novel Treatments and Chemoresponse in TGCT Patients.Int J Mol Sci. 2023 Apr 26;24(9):7873. doi: 10.3390/ijms24097873. Int J Mol Sci. 2023. PMID: 37175579 Free PMC article. Review.
-
m6A methylation regulators as predictors for treatment of advanced urothelial carcinoma with anti-PDL1 agent.Front Immunol. 2022 Sep 15;13:1014861. doi: 10.3389/fimmu.2022.1014861. eCollection 2022. Front Immunol. 2022. PMID: 36189296 Free PMC article.
-
IGF2BPs as novel m6A readers: Diverse roles in regulating cancer cell biological functions, hypoxia adaptation, metabolism, and immunosuppressive tumor microenvironment.Genes Dis. 2023 Jul 20;11(2):890-920. doi: 10.1016/j.gendis.2023.06.017. eCollection 2024 Mar. Genes Dis. 2023. PMID: 37692485 Free PMC article. Review.
-
The role of RNA modification in urological cancers: mechanisms and clinical potential.Discov Oncol. 2023 Dec 20;14(1):235. doi: 10.1007/s12672-023-00843-8. Discov Oncol. 2023. PMID: 38117350 Free PMC article. Review.
References
LinkOut - more resources
Full Text Sources
Other Literature Sources