. 2021 Feb 24:10:554138.
doi: 10.3389/fonc.2020.554138. eCollection 2020.

Identification of Immune-Related Therapeutically Relevant Biomarkers in Breast Cancer and Breast Cancer Stem Cells by Transcriptome-Wide Analysis: A Clinical Prospective Study

Affiliations

Identification of Immune-Related Therapeutically Relevant Biomarkers in Breast Cancer and Breast Cancer Stem Cells by Transcriptome-Wide Analysis: A Clinical Prospective Study

Linbang Wang et al. Front Oncol. .

Abstract

Cancer stem cells (CSCs) represent a subset of tumor cells that are responsible for recurrence and metastasis of tumors. These cells are resistant to radiotherapy and chemotherapy. Immunotherapeutic strategies that target CSCs specifically have provided initial results; however, the mechanism of action of these strategies is unclear. The data were requested from The Cancer Genome Atlas and Genotype-Tissue Expression, followed with the survival analysis and weighted gene co-expression network analysis to detect survival and stemness related genes. Patients were divided into three groups based on their immune status by applying single sample GSEA (ssGSEA) with proven dependability by ESTIMATE analysis. The filtered key genes were analyzed using oncomine, GEPIA, HPA, qRT-PCR, and functional analysis. Patients in a group with a higher stemness and a lower immune infiltration showed a worse overall survival probability, stemness and immune infiltration characteristics of breast cancer progressed in a non-linear fashion. Thirteen key genes related to stemness and immunity were identified and the functional analysis indicated their crucial roles in cell proliferation and immune escape strategies. The qRT-PCR results showed that the expression of PIMREG and MTFR2 differed in different stages of patients. Our study revealed a promising potential for CSC-target immunotherapy in the early stage of cancer and a probable value for PIMREG and MTFR2 as biomarkers and targets for immunotherapy.

Keywords: MTFR2; PIMREG; breast cancer; cancer stem cell; tumor immune infiltration.


Conflict of interest statement

The authors declare that the research was conducted in the absence of any commercial or financial relationships that could be construed as a potential conflict of interest.

Figures

Figure 1
Figure 1
Overall flowchart of key gene identification.
Figure 2
Figure 2
Screening of differentially expressed genes. The heat map of 2261 genes’ expression shows significant difference between normal and tumor samples. Green to red means the gene expression from low to high. The blue band in the top shows normal samples from GTEx and TCGA database and the red band shows cancer samples from TCGA database. (x: samples, y: genes).
Figure 3
Figure 3
Differentially analysis of mRNAsi in breast cancer. (A) The beeswarm plot shows significant difference of mRNAsi between normal (blue dot) and tumor (red dot) samples. The mRNAsi of most tumor samples is higher than normal samples. (B) The interactive genes between survival-related DEGs and mRNAsi-related genes. The Venn chat shows 193 survival-related DEGs (blue), 82 mRNAsi-related genes (red) and 18 interactive genes. (C) The beeswarm plot shows that TNM stages IV and II have higher mRNAsi. The order of average mRNAsi from high to low is stage IV, stage II, stage III, and stage I. (D) The beeswarm plot shows that T4 and T2 have higher mRNAsi. The order of average mRNAsi from high to low is T4, T2, T3, and T1. (E) TIMER revealed the correlation of key gene expressions with immune cells (including macrophages, neutrophils, dendritic cells, B cells, CD8+T cells, and CD4+T cells) infiltration level in BC.
Figure 4
Figure 4
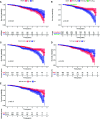
Analysis of prognosis value of mRNAsi and TME. (A) The K-M curve shows significant difference between low (blue) and high (red) mRNAsi groups within 5 year-follow-up. (B) The K-M curve shows significant differences between low infiltration (green), median infiltration (blue) and high infiltration (red) clusters. (C) The K-M curve shows significant difference between low (blue) and high (red) immune score cluster. (D) The K-M curve shows significant difference between low (blue) and high (red) tumor purity cluster. (E) The K-M curve shows significant difference between low (blue) and high (red) estimate score cluster.
Figure 5
Figure 5
Weighted gene co-expression network of breast cancer. (A) Confirmation of hub modules. The branches of the cluster dendrogram represent nine different gene modules with different colors. Every leaf corresponds to a gene. Dynamic Tree Cut corresponds to the original module and Merged Dynamic corresponds to the final module. (B) The correlation coefficient shows the relationship between the gene module and the clinical traits (mRNAsi and EREG-mRNAsi). Red corresponds to a positive correlation and blue corresponds to a negative correlation. The corresponding P-value is also annotated. Panels (C, D), respectively, represent for the cluster dendrogram and module-trait relationships of the soft threshold. (E) Scatter plot of module eigengenes in turquoise module.
Figure 6
Figure 6
Three infiltration clusters and TME relevance of BC patients after using ssGSEA according to 29 marker gene sets. (A) 1069 BC samples are divided into high infiltration (red band), median infiltration (green band), and low infiltration clusters (blue band). The assessment of infiltration clusters conducted by TME are clustered into stromal score (B), immune score (C), and tumor purity (E) estimate score (D). (ns, p > 0.05; *p < 0.05; **p < 0.01; ***p < 0.001).
Figure 7
Figure 7
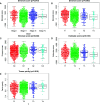
Analysis of clinicopathological characteristics of mRNAsi and TME. (A) The beeswarm plot shows TNM stage I and stage III have higher stromal score. The order of average stromal score from high to low is TNM stage I, TNM stage III, TNM stage II, and TNM stage IV. (B) The beeswarm plot shows that T1 has a higher stromal score. The order of average stromal score from high to low is T1, T2, T3, and T4. (C) The beeswarm plot shows that N2 and N3 have higher stromal score. The order of average stromal score from low to high is N1, N0, N3, and N2. (D) The beeswarm plot shows that T1 and T3 have higher Estimate score. The order of average Estimate score from high to low is T1, T3, T2, and T4. (E) The beeswarm plot shows that T1 and T3 have lower tumor purity. The order of average tumor purity from low to high is T1, T3, T2, and T4.
Figure 8
Figure 8
Correlation analysis between 18 mRNAsi-related genes and infiltration clusters. (A) to (R) shows the expression levels of the mRNAsi-related genes in different clusters.The boxplots show there is no statistical difference on the expression of DSCC1 (D), ERCC6L (E), GINS1 (G), KIF4A (H) and RACGAP1 (L) between 3 infiltration clusters. While the left genes (ANLN, CCNB2, CEP55, FAM83D, MELK, MTFR2, PIMREG, RAD54L, RAD51, SHCBP1, SKA1, UBE2T, and SKA3) are analyzed with a difference between infiltration clusters. (ns, p > 0.05; *p < 0.05; **p < 0.01; ***p < 0.001).
Figure 9
Figure 9
Difference analysis of the gene expression between normal and tumor samples. (A) The boxplot shows significant difference of gene expression between normal and tumor sample. The expression of these 13 genes in tumor sample are higher than in normal samples. (B) The heatmap shows the expression change of genes from normal (blue band) to tumor (red band) samples. Green to red means gene expression from low to high. ***p < 0.001.
Figure 10
Figure 10
Survival analysis of 13 key genes. (A–M) shows the different survival time of patients between low and high expression of 13 genes. All the K-M curve shows significant difference that low expression of these genes has a longer OS.
Figure 11
Figure 11
The interaction between key genes. (A) Mantel analysis of co-expression of 13 key genes and clinical information, Class01 to Class05, respectively, represent the survival times and status, TNM stage, tumor microenvironment, mRNAsi and EREG-mRNAsi, and immune group. (B) PPI network analysis of 13 key genes. Thickness of the solid line represents the strength of the relationship. (C) Histogram shows the number of nodes of 13 key genes in PPI network.
Figure 12
Figure 12
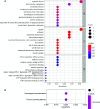
GO and KEGG pathway enrichment analysis of key genes. The size of the circle represents the number of genes and the y-axis shows the GO and KEGG pathway terms. The redder the color the higher the value of p. Molecular Function (MF); Biological Process (BP) and Cellular Component (CC). (A) Enrichment of Gene Ontology (GO) analysis. (B) Enrichment of Kyoto Encyclopedia of Genes and Genomes (KEGG) pathway analysis.
Figure 13
Figure 13
The mRNA expression of key genes in multiple cancers and in BC patients. (A) The expression of key genes in pan-cancer scale is evaluated by Oncomine, the number in the table cell is determined by the number of data that meet thresholds. The color depth represents the gene rank. The red cells suggest that the expression levels of key genes are relatively higher in tumor tissues, while blue cells imply the opposite. (BG) The result of qRT-PCR compared the differential expression of key gene in tumor and para-carcinoma tissue of patients, the expression between patients in stage II and stage III group is also evaluated. (H, J, L) The immunohistochemical staining revealed the staining patterns of PIMREG, MTFR2 and CEP55 between breast cancer samples and normal mammary samples. (I, K, M) PIMREG, MTFR2 and CEP55 expression profile of breast cancer patients from GEPIA database. (N–R) relative expression level of ALDH1A1, CD44, CEP55, MTFR2, and PIMREG in MCF7 and MDA-MB-231 cell lines.
Figure 14
Figure 14
Schematic diagram of immuno-resistance profile of the CSCs.

Similar articles

Cited by

References

    1. DeSantis CE, Ma J, Goding Sauer A, Newman LA, Jemal A. Breast cancer statistics, 2017, racial disparity in mortality by state. CA: Cancer J Clin (2017) 67(6):439–48. 10.3322/caac.21412 - DOI - PubMed
    1. Liu Z, Zhang XS, Zhang S. Breast tumor subgroups reveal diverse clinical prognostic power. Sci Rep (2014) 4:4002. 10.1038/srep04002 - DOI - PMC - PubMed
    1. Stingl J, Caldas C. Molecular heterogeneity of breast carcinomas and the cancer stem cell hypothesis. Nat Rev Cancer (2007) 7(10):791–9. 10.1038/nrc2212 - DOI - PubMed
    1. Bianchini G, Balko JM, Mayer IA, Sanders ME, Gianni L. Triple-negative breast cancer: challenges and opportunities of a heterogeneous disease. Nat Rev Clin Oncol (2016) 13(11):674–90. 10.1038/nrclinonc.2016.66 - DOI - PMC - PubMed
    1. Bai X, Ni J, Beretov J, Graham P, Li Y. Cancer stem cell in breast cancer therapeutic resistance. Cancer Treat Rev (2018) 69:152–63. 10.1016/j.ctrv.2018.07.004 - DOI - PubMed

LinkOut - more resources