

Exploration of the Prognostic and Immunotherapeutic Value of B and T Lymphocyte Attenuator in Skin Cutaneous Melanoma
- PMID: 33718105
- PMCID: PMC7953043
- DOI: 10.3389/fonc.2020.592811
Exploration of the Prognostic and Immunotherapeutic Value of B and T Lymphocyte Attenuator in Skin Cutaneous Melanoma
Abstract
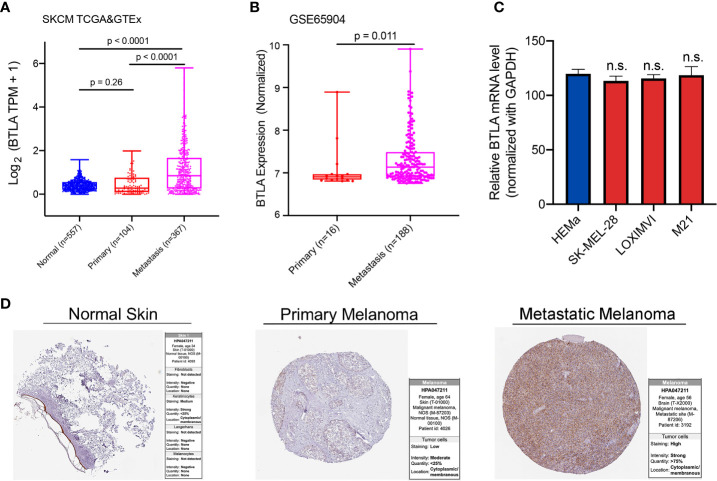
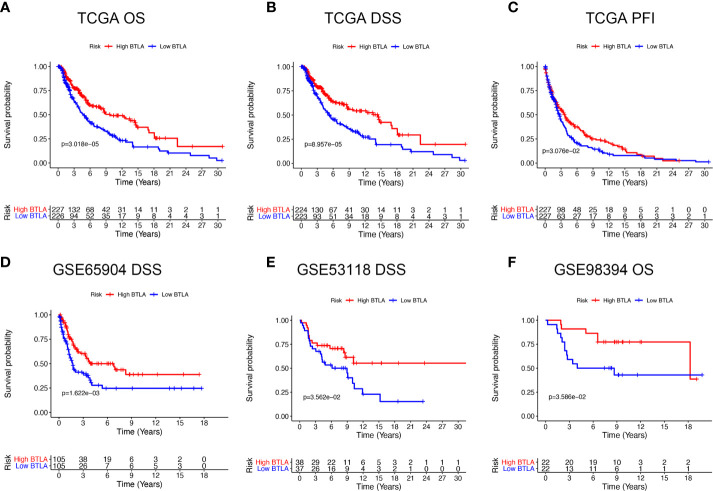
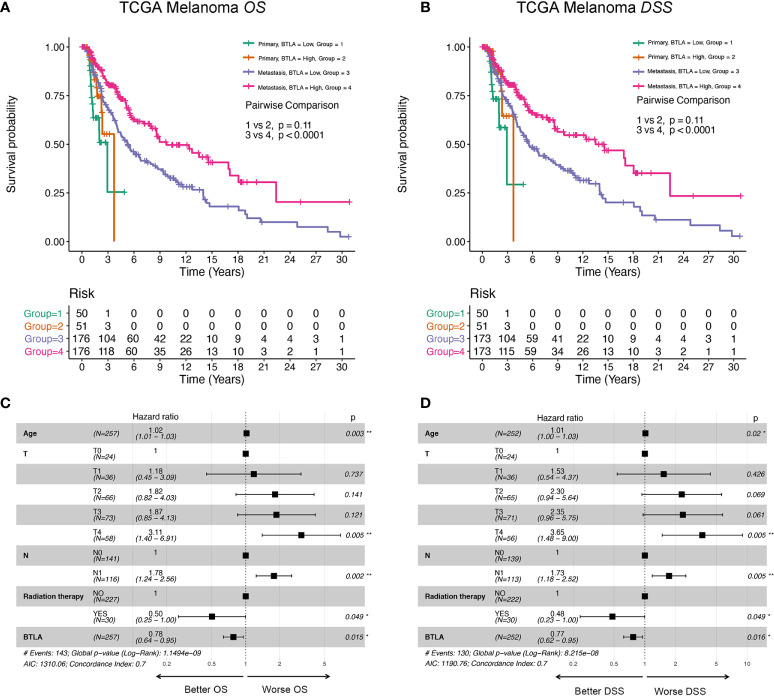
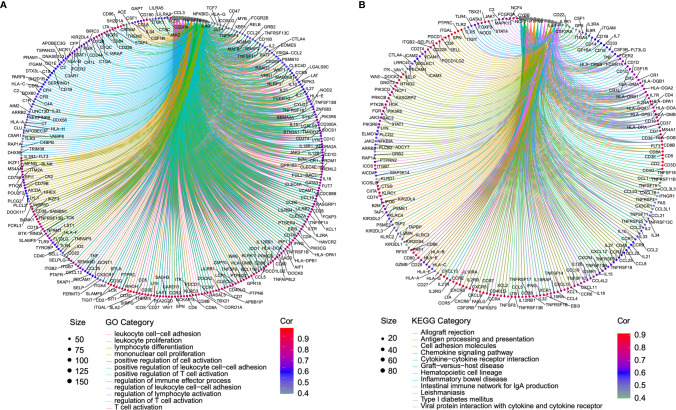
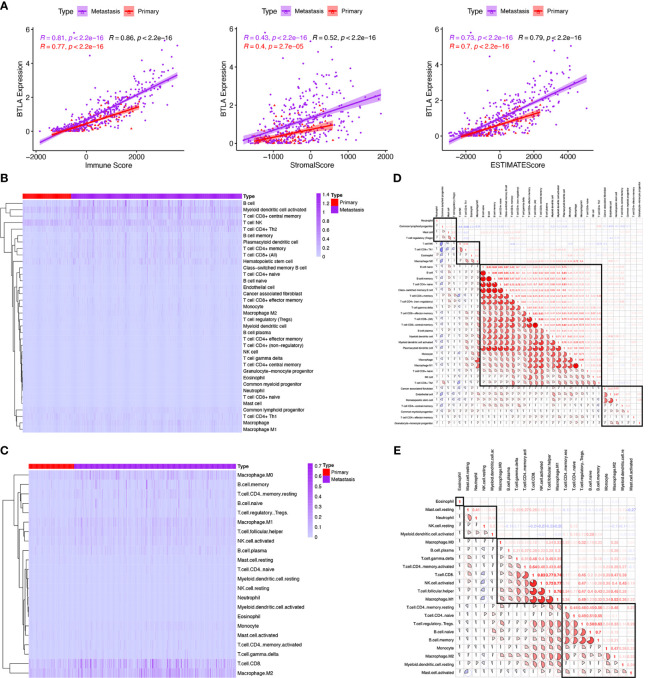
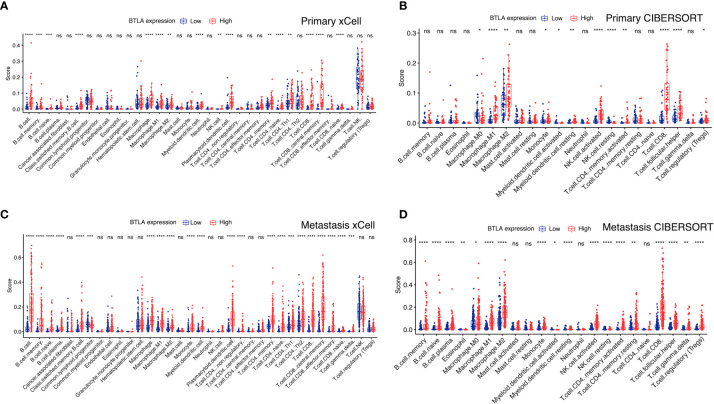
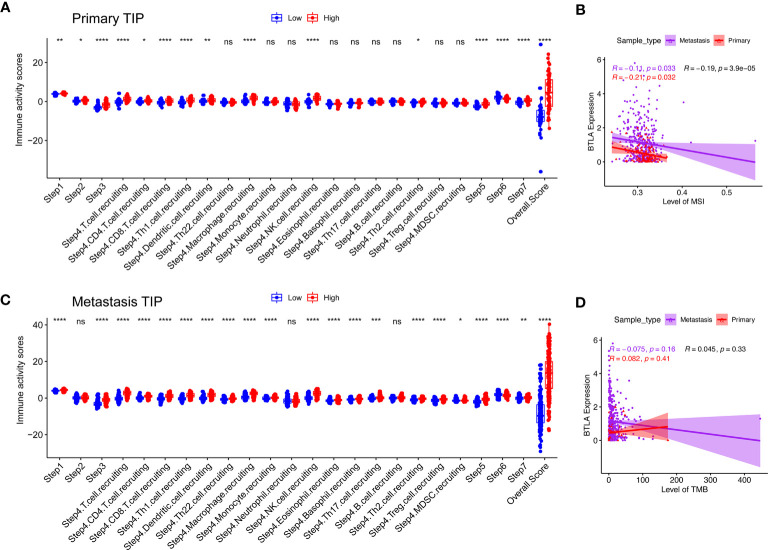
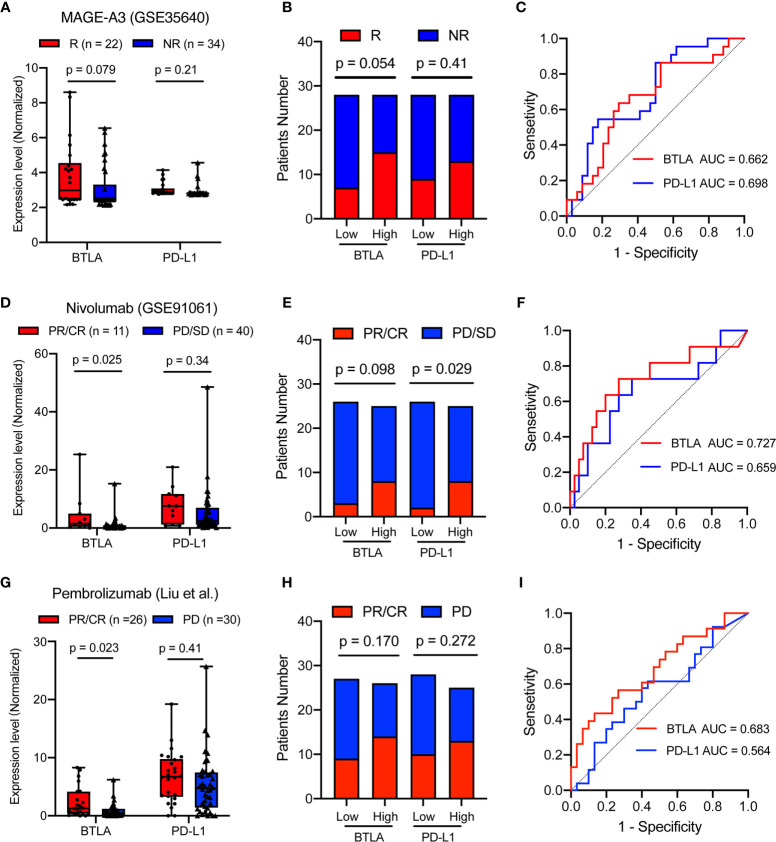
B and T lymphocyte attenuator (BTLA) is a newly identified immune checkpoint molecular belonging to the CD28 immunoglobulin superfamily. However, the expression and clinical value of BTLA in skin cutaneous melanoma (SKCM) has not been widely characterized. We found that BTLA levels were upregulated in metastatic melanoma compared to normal skin tissues and primary melanoma. Higher BTLA was also correlated with improved prognosis in SKCM based on several datasets. The multivariate Cox regression model revealed that BTLA was an independent survival indicator in metastatic melanoma. Tumor microenvironment analysis indicated BTLA was positively associated with the infiltrating levels of different immune cells and the activity of the anti-cancer immunity cycle. Importantly, BTLA accurately predicted the outcome of melanoma patients treated with MAGE-A3 blocker or first-line anti-PD-1. The present findings disclose that BTLA is a reliable biomarker for prognosis and immunotherapeutic response and might contribute to developing novel SKCM immunological treatment strategies.
Keywords: B and T lymphocyte attenuator (BTLA); immunotherapy; prognosis; skin cutaneous melanoma; tumor microenvironment; tumor-infiltration.
Copyright © 2021 Dong, Song, Chen, Qi, Jiang, Li, Zheng, Wang, Zhang and Liu.
Conflict of interest statement
The authors declare that the research was conducted in the absence of any commercial or financial relationships that could be construed as a potential conflict of interest.
Figures
Similar articles
-
BTLA promoter hypomethylation correlates with enhanced immune cell infiltration, favorable prognosis, and immunotherapy response in melanoma.J Immunother Cancer. 2025 Mar 13;13(3):e009841. doi: 10.1136/jitc-2024-009841. J Immunother Cancer. 2025. PMID: 40081944 Free PMC article.
-
Friend or Foe: Prognostic and Immunotherapy Roles of BTLA in Colorectal Cancer.Front Mol Biosci. 2020 Jul 21;7:148. doi: 10.3389/fmolb.2020.00148. eCollection 2020. Front Mol Biosci. 2020. PMID: 32793631 Free PMC article.
-
Development and validation of an immune gene set-based prognostic signature in cutaneous melanoma.Future Oncol. 2021 Nov;17(31):4115-4129. doi: 10.2217/fon-2021-0104. Epub 2021 Jul 22. Future Oncol. 2021. PMID: 34291650
-
BTLA biology in cancer: from bench discoveries to clinical potentials.Biomark Res. 2024 Jan 17;12(1):8. doi: 10.1186/s40364-024-00556-2. Biomark Res. 2024. PMID: 38233898 Free PMC article. Review.
-
BTLA-HVEM Couple in Health and Diseases: Insights for Immunotherapy in Lung Cancer.Front Oncol. 2021 Aug 31;11:682007. doi: 10.3389/fonc.2021.682007. eCollection 2021. Front Oncol. 2021. PMID: 34532285 Free PMC article. Review.
Cited by
-
Plasma Exosome-Derived SENP1 May Be a Potential Prognostic Predictor for Melanoma.Front Oncol. 2021 Aug 5;11:685009. doi: 10.3389/fonc.2021.685009. eCollection 2021. Front Oncol. 2021. PMID: 34422639 Free PMC article.
-
Oxidative Stress and Immune Response in Melanoma: Ion Channels as Targets of Therapy.Int J Mol Sci. 2023 Jan 3;24(1):887. doi: 10.3390/ijms24010887. Int J Mol Sci. 2023. PMID: 36614330 Free PMC article. Review.
-
BTLA promoter hypomethylation correlates with enhanced immune cell infiltration, favorable prognosis, and immunotherapy response in melanoma.J Immunother Cancer. 2025 Mar 13;13(3):e009841. doi: 10.1136/jitc-2024-009841. J Immunother Cancer. 2025. PMID: 40081944 Free PMC article.
-
Exploring the role of pomalidomide in androgen-dependent prostate cancer: a computational analysis.Mol Divers. 2024 Dec 21. doi: 10.1007/s11030-024-11081-7. Online ahead of print. Mol Divers. 2024. PMID: 39708063
-
Advanced Acral Melanoma Therapies: Current Status and Future Directions.Curr Treat Options Oncol. 2022 Oct;23(10):1405-1427. doi: 10.1007/s11864-022-01007-6. Epub 2022 Sep 20. Curr Treat Options Oncol. 2022. PMID: 36125617 Free PMC article. Review.
References
-
- Patel A, Moyers J, Nagaraj G. Immunotherapy in metastatic melanoma: A sociodemographic analysis of the National Cancer Database. J Clin Oncol (2020) 38(5_suppl):87–. 10.1200/JCO.2020.38.5_suppl.87 - DOI
LinkOut - more resources
Full Text Sources
Other Literature Sources
Research Materials