

MYCN Drives a Tumor Immunosuppressive Environment Which Impacts Survival in Neuroblastoma
- PMID: 33718189
- PMCID: PMC7951059
- DOI: 10.3389/fonc.2021.625207
MYCN Drives a Tumor Immunosuppressive Environment Which Impacts Survival in Neuroblastoma
Abstract
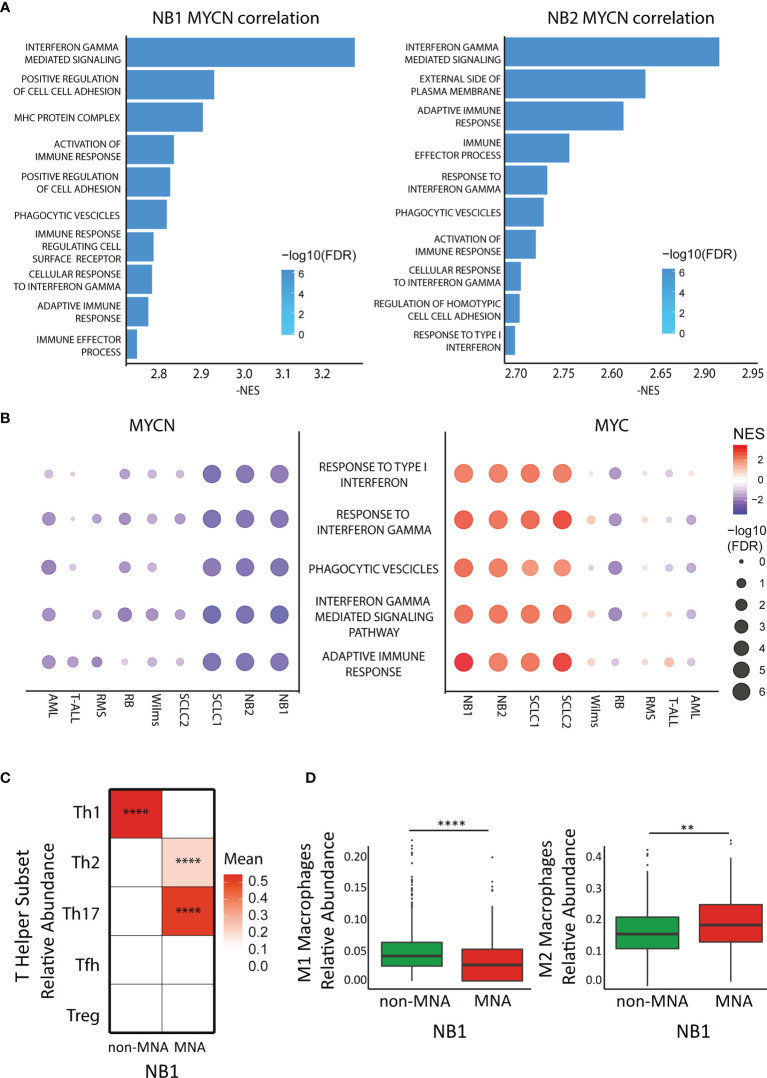
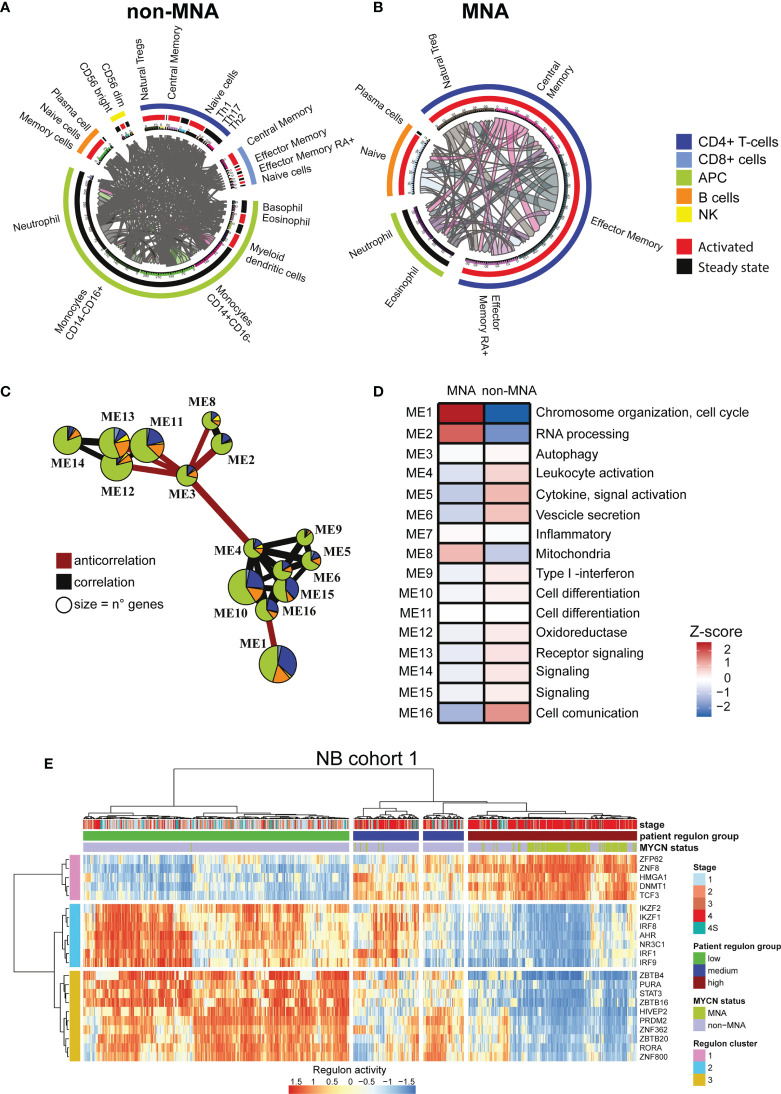
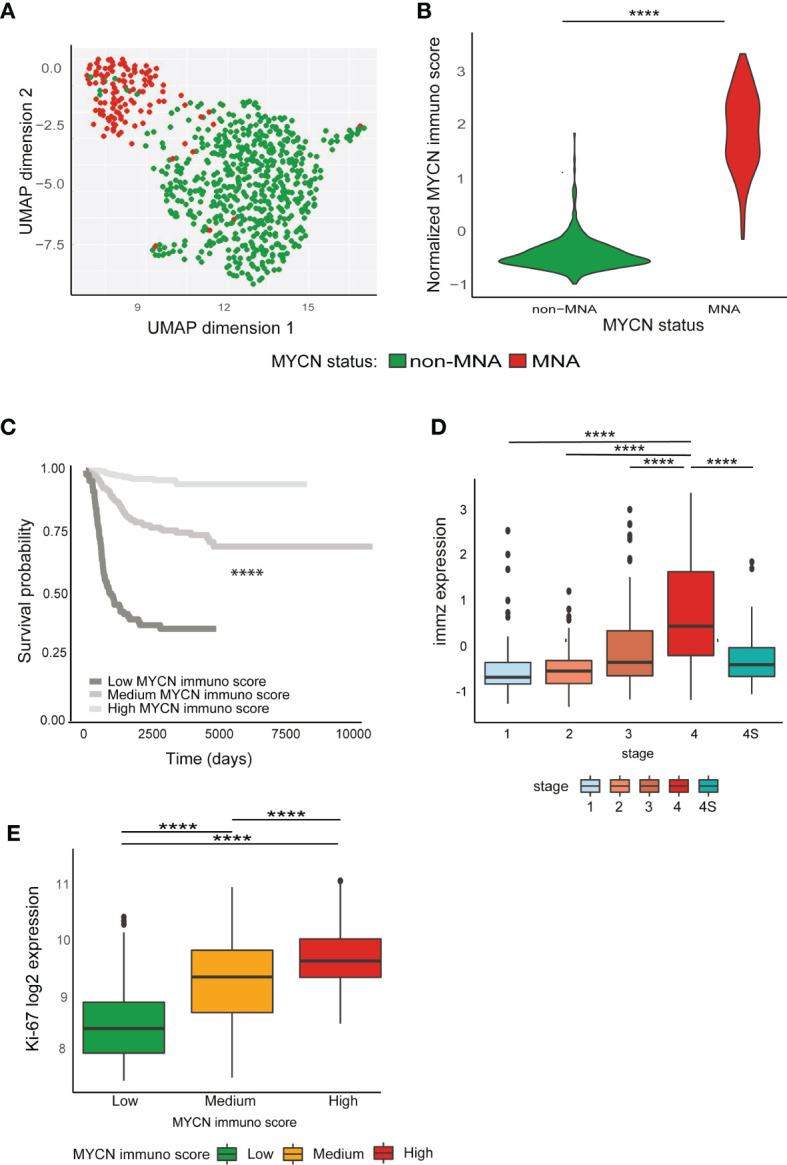
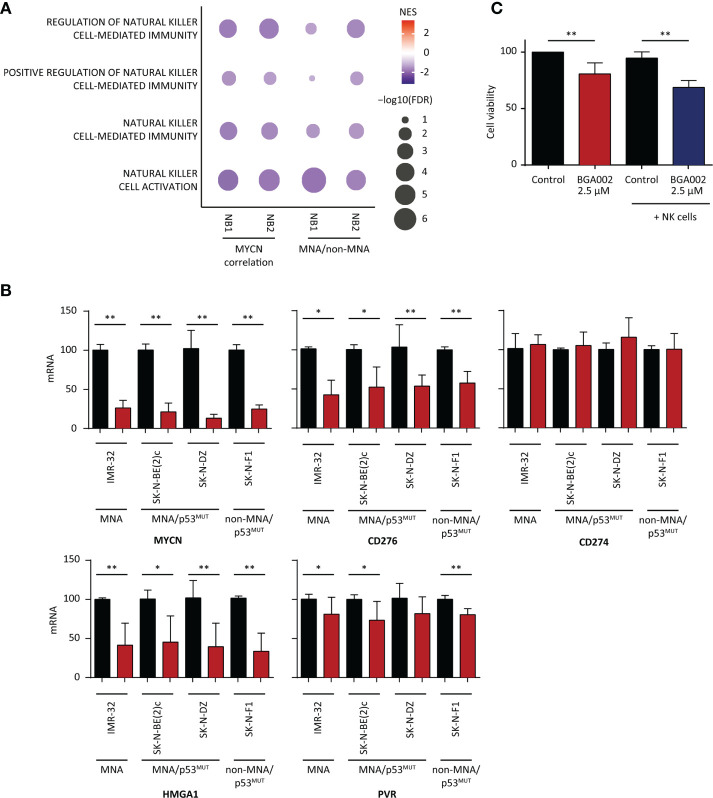
A wide range of malignancies presents MYCN amplification (MNA) or dysregulation. MYCN is associated with poor prognosis and its over-expression leads to several dysregulations including metabolic reprogramming, mitochondria alteration, and cancer stem cell phenotype. Some hints suggest that MYCN overexpression leads to cancer immune-escape. However, this relationship presents various open questions. Our work investigated in details the relationship of MYCN with the immune system, finding a correlated immune-suppressive phenotype in neuroblastoma (NB) and different cancers where MYCN is up-regulated. We found a downregulated Th1-lymphocytes/M1-Macrophages axis and upregulated Th2-lymphocytes/M2-macrophages in MNA NB patients. Moreover, we unveiled a complex immune network orchestrated by N-Myc and we identified 16 genes modules associated to MNA NB. We also identified a MYCN-associated immune signature that has a prognostic value in NB and recapitulates clinical features. Our signature also discriminates patients with poor survival in non-MNA NB patients where MYCN expression is not discriminative. Finally, we showed that targeted inhibition of MYCN by BGA002 (anti-MYCN antigene PNA) is able to restore NK sensibility in MYCN-expressing NB cells. Overall, our study unveils a MYCN-driven immune network in NB and shows a therapeutic option to restore sensibility to immune cells.
Keywords: MYCN; MYCN blocking; anti-MYCN antigene PNA; immune network; immune signature; immune system; neuroblastoma.
Copyright © 2021 Raieli, Di Renzo, Lampis, Amadesi, Montemurro, Pession, Hrelia, Fischer and Tonelli.
Conflict of interest statement
RT and AP are co-founders and shareholders of Biogenera. Authors SR, SL and CA are employed by Biogenera. The remaining authors declare that the research was conducted in the absence of any commercial or financial relationships that could be construed as a potential conflict of interest.
Figures
Similar articles
-
The MYCN inhibitor BGA002 restores the retinoic acid response leading to differentiation or apoptosis by the mTOR block in MYCN-amplified neuroblastoma.J Exp Clin Cancer Res. 2022 Apr 30;41(1):160. doi: 10.1186/s13046-022-02367-5. J Exp Clin Cancer Res. 2022. PMID: 35490242 Free PMC article.
-
A Novel MYCN-Specific Antigene Oligonucleotide Deregulates Mitochondria and Inhibits Tumor Growth in MYCN-Amplified Neuroblastoma.Cancer Res. 2019 Dec 15;79(24):6166-6177. doi: 10.1158/0008-5472.CAN-19-0008. Epub 2019 Oct 15. Cancer Res. 2019. PMID: 31615807
-
Human embryonic stem cell-derived neural crest model unveils CD55 as a cancer stem cell regulator for therapeutic targeting in MYCN-amplified neuroblastoma.Neuro Oncol. 2022 Jun 1;24(6):872-885. doi: 10.1093/neuonc/noab241. Neuro Oncol. 2022. PMID: 34655293 Free PMC article.
-
The MYCN oncogene as a specific and selective drug target for peripheral and central nervous system tumors.Curr Cancer Drug Targets. 2005 Jun;5(4):273-83. doi: 10.2174/1568009054064606. Curr Cancer Drug Targets. 2005. PMID: 15975048 Review.
-
Natural killer cells and neuroblastoma: tumor recognition, escape mechanisms, and possible novel immunotherapeutic approaches.Front Immunol. 2014 Feb 12;5:56. doi: 10.3389/fimmu.2014.00056. eCollection 2014. Front Immunol. 2014. PMID: 24575100 Free PMC article. Review.
Cited by
-
Transition to a mesenchymal state in neuroblastoma may be characterized by a high expression of GD2 and by the acquisition of immune escape from NK cells.Front Immunol. 2024 Apr 26;15:1382931. doi: 10.3389/fimmu.2024.1382931. eCollection 2024. Front Immunol. 2024. PMID: 38736882 Free PMC article.
-
MYCN Impact on High-Risk Neuroblastoma: From Diagnosis and Prognosis to Targeted Treatment.Cancers (Basel). 2022 Sep 12;14(18):4421. doi: 10.3390/cancers14184421. Cancers (Basel). 2022. PMID: 36139583 Free PMC article. Review.
-
Loss of ARID1A leads to a cold tumor phenotype via suppression of IFNγ signaling.Sci Rep. 2025 Mar 13;15(1):8716. doi: 10.1038/s41598-025-91688-4. Sci Rep. 2025. PMID: 40082458 Free PMC article.
-
Monocyte and Macrophage in Neuroblastoma: Blocking Their Pro-Tumoral Functions and Strengthening Their Crosstalk with Natural Killer Cells.Cells. 2023 Mar 13;12(6):885. doi: 10.3390/cells12060885. Cells. 2023. PMID: 36980226 Free PMC article. Review.
-
Multicellular model of neuroblastoma proposes unconventional therapy based on multiple roles of p53.PLoS Comput Biol. 2024 Dec 23;20(12):e1012648. doi: 10.1371/journal.pcbi.1012648. eCollection 2024 Dec. PLoS Comput Biol. 2024. PMID: 39715281 Free PMC article.
References
-
- Rickman DS, Schulte JH, Eilers M. The Expanding World of N-MYC–Driven Tumors. Cancer Discov (2018) 8:150–63. 10.1158/2159-8290.CD-17-0273 - DOI - PubMed
LinkOut - more resources
Full Text Sources
Other Literature Sources