

Identification and Validation of Ubiquitin-Specific Proteases as a Novel Prognostic Signature for Hepatocellular Carcinoma
- PMID: 33718205
- PMCID: PMC7949004
- DOI: 10.3389/fonc.2021.629327
Identification and Validation of Ubiquitin-Specific Proteases as a Novel Prognostic Signature for Hepatocellular Carcinoma
Abstract
Purpose: Ubiquitin-specific proteases (USPs), as a sub-family of deubiquitinating enzymes (DUBs), are responsible for the elimination of ubiquitin-triggered modification. USPs are recently correlated with various malignancies. However, the expression features and clinical significance of USPs have not been systematically investigated in hepatocellular carcinoma (HCC).
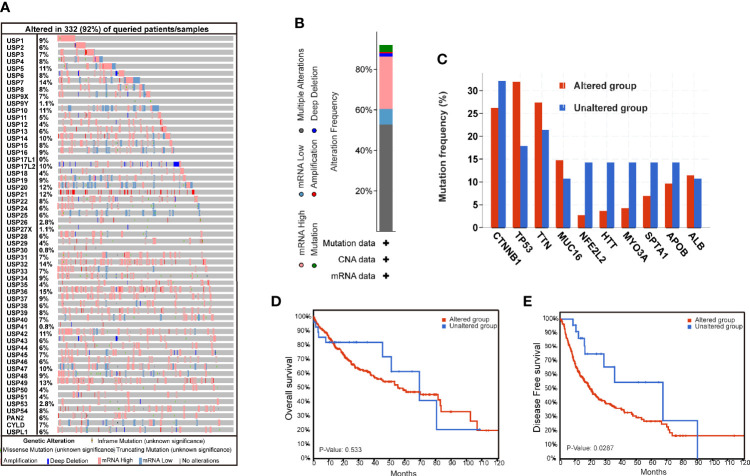
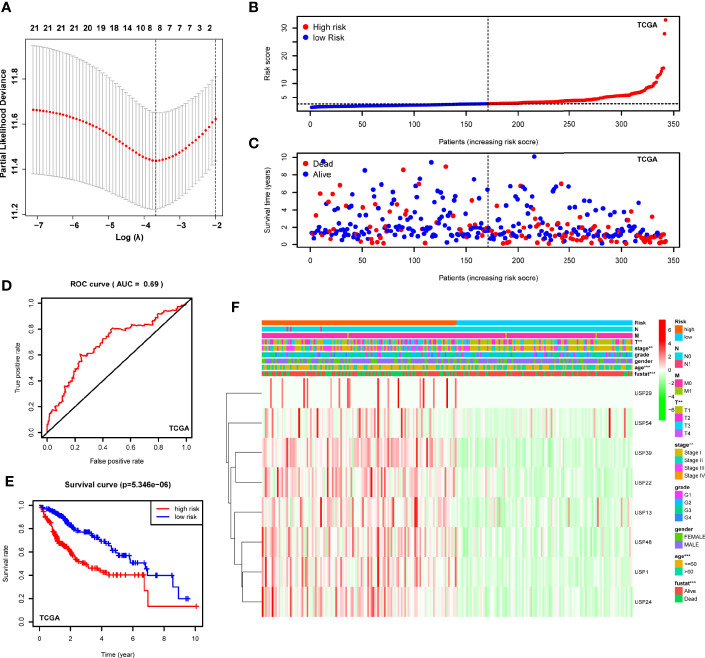
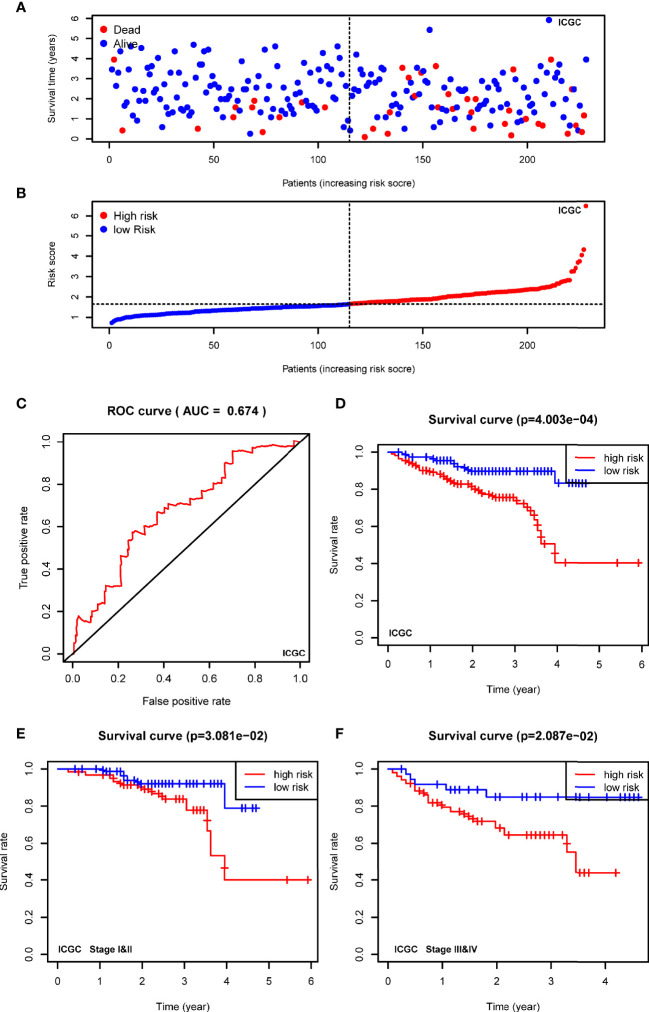
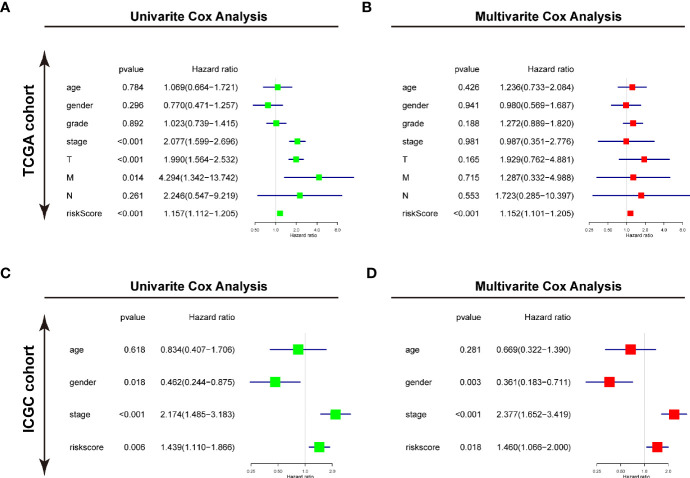
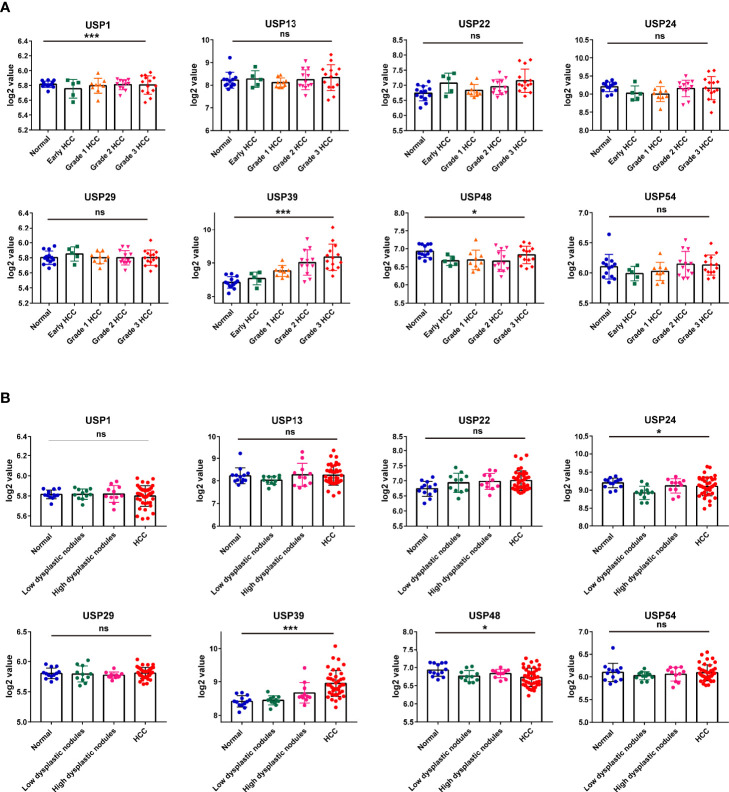
Methods: Genomic alterations and expression profiles of USPs were investigated in CbioPortal and The Cancer Genome Atlas (TCGA) Liver hepatocellular carcinoma (LIHC) dataset. Cox regression and least absolute shrinkage and selection operator (LASSO) analyses were conducted to establish a risk signature for HCC prognosis in TCGA LIHC cohort. Subsequently, Kaplan-Meier analysis, receiver operating characteristic (ROC) curves and univariate/multivariate analyses were performed to evaluate the prognostic significance of the risk signature in TCGA LIHC and international cancer genome consortium (ICGC) cohorts. Furthermore, we explored the alterations of the signature genes during hepatocarcinogenesis and HCC progression in GSE89377. In addition, the expression feature of USP39 was further explored in HCC tissues by performing western blotting and immunohistochemistry.
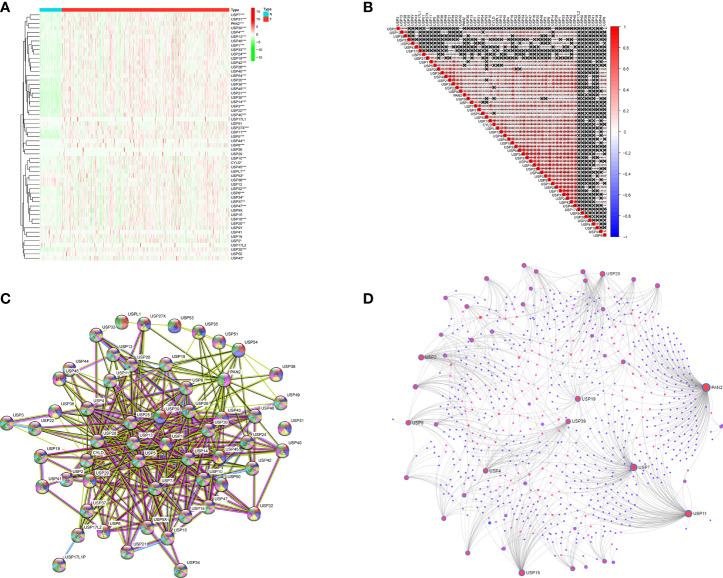
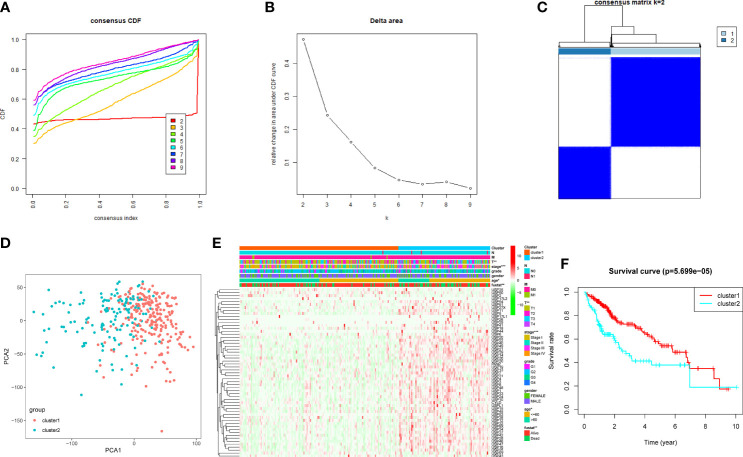
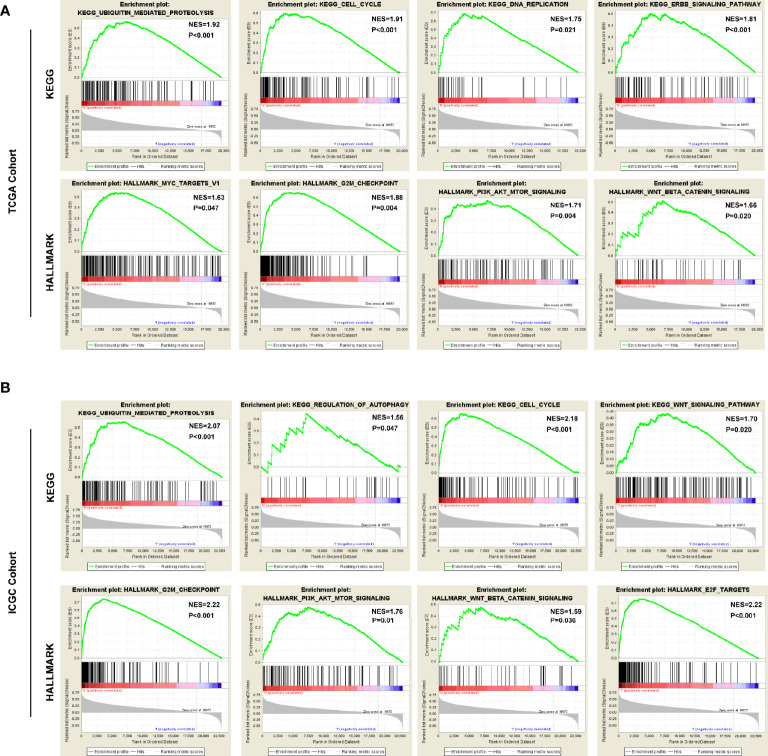
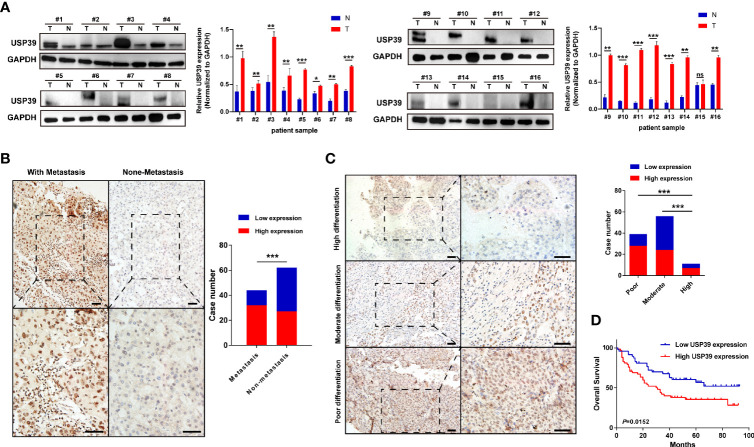
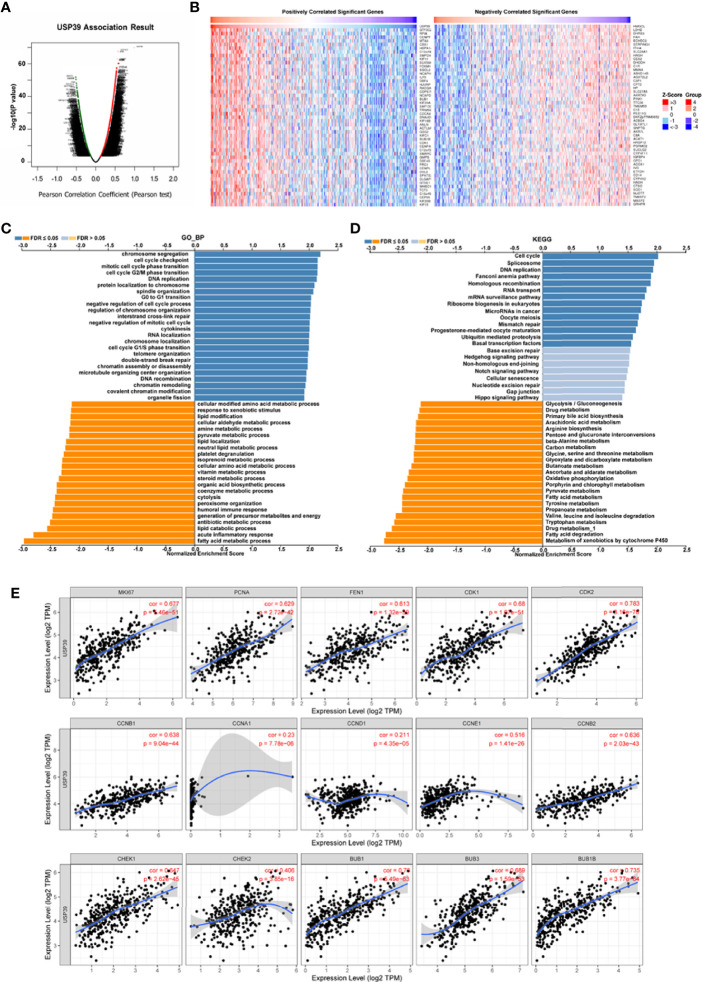
Results: Genomic alterations and overexpression of USPs were observed in HCC tissues. The consensus analysis indicated that the USPs-overexpressed sub-Cluster was correlated with aggressive characteristics and poor prognosis. Cox regression with LASSO algorithm identified a risk signature formed by eight USPs for HCC prognosis. High-risk group stratified by the signature score was correlated with advanced tumor stage and poor survival HCC patients in TCGA LIHC cohort. In addition, the 8-USPs based signature could also robustly predict overall survival of HCC patients in ICGC(LIRI-JP) cohort. Furthermore, gene sets enrichment analysis (GSEA) showed that the high-risk score was associated with tumor-related pathways. According to the observation in GSE89377, USP39 expression was dynamically increased with hepatocarcinogenesis and HCC progression. The overexpression of USP39 was further determined in a local HCC cohort and correlated with poor prognosis. The co-concurrence analysis suggested that USP39 might promote HCC by regulating cell-cycle- and proliferation- related genes.
Conclusion: The current study provided a USPs-based signature, highlighting its robust prognostic significance and targeted value for HCC treatment.
Keywords: hepatocellular carcinoma; molecular target; prognosis; risk signature; ubiquitin-specific proteases.
Copyright © 2021 Ni, Bian, Zhu, Song, Zhang, Xiao and Zheng.
Conflict of interest statement
The authors declare that the research was conducted in the absence of any commercial or financial relationships that could be construed as a potential conflict of interest.
Figures
Similar articles
-
Cuproptosis-related molecular classification and gene signature of hepatocellular carcinoma and experimental verification.Transl Cancer Res. 2024 Mar 31;13(3):1268-1289. doi: 10.21037/tcr-23-1876. Epub 2024 Mar 27. Transl Cancer Res. 2024. PMID: 38617510 Free PMC article.
-
Identification of a Pyroptosis-Related Prognostic Signature Combined With Experiments in Hepatocellular Carcinoma.Front Mol Biosci. 2022 Mar 4;9:822503. doi: 10.3389/fmolb.2022.822503. eCollection 2022. Front Mol Biosci. 2022. PMID: 35309514 Free PMC article.
-
Identification of an Endoplasmic Reticulum Stress-Related Gene Signature to Evaluate the Immune Status and Predict the Prognosis of Hepatocellular Carcinoma.Front Genet. 2022 May 27;13:850200. doi: 10.3389/fgene.2022.850200. eCollection 2022. Front Genet. 2022. PMID: 35711939 Free PMC article.
-
Role of ubiquitin specific proteases in the immune microenvironment of prostate cancer: A new direction.Front Oncol. 2022 Jul 18;12:955718. doi: 10.3389/fonc.2022.955718. eCollection 2022. Front Oncol. 2022. PMID: 35924159 Free PMC article. Review.
-
Emerging potential of ubiquitin-specific proteases and ubiquitin-specific proteases inhibitors in breast cancer treatment.World J Clin Cases. 2022 Nov 16;10(32):11690-11701. doi: 10.12998/wjcc.v10.i32.11690. World J Clin Cases. 2022. PMID: 36405275 Free PMC article. Review.
Cited by
-
USP39: a key regulator in malignant tumor progression.Front Oncol. 2025 Jul 2;15:1556011. doi: 10.3389/fonc.2025.1556011. eCollection 2025. Front Oncol. 2025. PMID: 40672756 Free PMC article. Review.
-
Identification of a Prognostic Signature for Ovarian Cancer Based on Ubiquitin-Related Genes Suggesting a Potential Role for FBXO9.Biomolecules. 2023 Nov 30;13(12):1724. doi: 10.3390/biom13121724. Biomolecules. 2023. PMID: 38136595 Free PMC article.
-
Exploring the cancerous nexus: the pivotal and diverse roles of USP39 in cancer development.Discov Oncol. 2025 May 10;16(1):715. doi: 10.1007/s12672-025-02480-9. Discov Oncol. 2025. PMID: 40347416 Free PMC article. Review.
-
Ubiquitin-related gene markers predict immunotherapy response and prognosis in patients with epithelial ovarian carcinoma.Sci Rep. 2024 Oct 24;14(1):25239. doi: 10.1038/s41598-024-76945-2. Sci Rep. 2024. PMID: 39448713 Free PMC article.
-
High Expression of Ubiquitin-Specific Protease 39 and Its Roles in Prognosis in Patients with Hepatocellular Carcinoma.Evid Based Complement Alternat Med. 2021 Dec 27;2021:6233175. doi: 10.1155/2021/6233175. eCollection 2021. Evid Based Complement Alternat Med. 2021. PMID: 34987596 Free PMC article.
References
LinkOut - more resources
Full Text Sources
Other Literature Sources