Therapeutic Cancer Vaccination With a Peptide Derived From the Calreticulin Exon 9 Mutations Induces Strong Cellular Immune Responses in Patients With CALR-Mutant Chronic Myeloproliferative Neoplasms
- PMID: 33718228
- PMCID: PMC7952976
- DOI: 10.3389/fonc.2021.637420
Therapeutic Cancer Vaccination With a Peptide Derived From the Calreticulin Exon 9 Mutations Induces Strong Cellular Immune Responses in Patients With CALR-Mutant Chronic Myeloproliferative Neoplasms
Abstract
Background: The calreticulin (CALR) exon 9 mutations that are identified in 20% of patients with Philadelphia chromosome negative chronic myeloproliferative neoplasms (MPN) generate immunogenic antigens. Thus, therapeutic cancer vaccination against mutant CALR could be a new treatment modality in CALR-mutant MPN.
Methods: The safety and efficacy of vaccination with the peptide CALRLong36 derived from the CALR exon 9 mutations was tested in a phase I clinical vaccination trial with montanide as adjuvant. Ten patients with CALRmut MPN were included in the trial and received 15 vaccines over the course of one year. The primary end point was evaluation of safety and toxicity of the vaccine. Secondary endpoint was assessment of the immune response to the vaccination epitope (www.clinicaltrials.gov identifier NCT03566446).
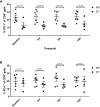
Results: Patients had a median age of 59.5 years and a median disease duration of 6.5 years. All patients received the intended 15 vaccines, and the vaccines were deemed safe and tolerable as only two grade three AE were detected, and none of these were considered to be related to the vaccine. A decline in platelet counts relative to the platelets counts at baseline was detected during the first 100 days, however this did not translate into neither a clinical nor a molecular response in any of the patients. Immunomonitoring revealed that four of 10 patients had an in vitro interferon (IFN)-γ ELISPOT response to the CALRLong36 peptide at baseline, and four additional patients displayed a response in ELISPOT upon receiving three or more vaccines. The amplitude of the immune response increased during the entire vaccination schedule for patients with essential thrombocythemia. In contrast, the immune response in patients with primary myelofibrosis did not increase after three vaccines.
Conclusion: Therapeutic cancer vaccination with peptide vaccines derived from mutant CALR with montanide as an adjuvant, is safe and tolerable. The vaccines did not induce any clinical responses. However, the majority of patients displayed a marked T-cell response to the vaccine upon completion of the trial. This suggests that vaccines directed against mutant CALR may be used with other cancer therapeutic modalities to enhance the anti-tumor immune response.
Keywords: calreticulin; cancer immune therapy; cancer vaccines; myeloproliferative neoplasms; neo-antigen.
Copyright © 2021 Handlos Grauslund, Holmström, Jørgensen, Klausen, Weis-Banke, El Fassi, Schöllkopf, Clausen, Gjerdrum, Breinholt, Kjeldsen, Hansen, Koschmieder, Chatain, Novotny, Petersen, Kjær, Skov, Met, Svane, Hasselbalch and Andersen.
Conflict of interest statement
MOH, HH, and MA have filed a patent regarding the CALR exon 9 mutations as a target for cancer immune therapy. The patent has been transferred to University Hospital Zealand, Zealand Region and Copenhagen University Hospital at Herlev, Capital Region according to Danish Law concerning inventions made at public research institutions. The remaining authors declare that the research was conducted in the absence of any commercial or financial relationships that could be construed as a potential conflict of interest.
Figures


Similar articles
-
Therapeutic cancer vaccination against mutant calreticulin in myeloproliferative neoplasms induces expansion of specific T cells in the periphery but specific T cells fail to enrich in the bone marrow.Front Immunol. 2023 Aug 17;14:1240678. doi: 10.3389/fimmu.2023.1240678. eCollection 2023. Front Immunol. 2023. PMID: 37662956 Free PMC article.
-
The calreticulin (CALR) exon 9 mutations are promising targets for cancer immune therapy.Leukemia. 2018 Feb;32(2):429-437. doi: 10.1038/leu.2017.214. Epub 2017 Jul 5. Leukemia. 2018. PMID: 28676668
-
An arginase1- and PD-L1-derived peptide-based vaccine for myeloproliferative neoplasms: A first-in-man clinical trial.Front Immunol. 2023 Feb 23;14:1117466. doi: 10.3389/fimmu.2023.1117466. eCollection 2023. Front Immunol. 2023. PMID: 36911725 Free PMC article.
-
Evidence of immune elimination, immuno-editing and immune escape in patients with hematological cancer.Cancer Immunol Immunother. 2020 Feb;69(2):315-324. doi: 10.1007/s00262-019-02473-y. Epub 2020 Jan 8. Cancer Immunol Immunother. 2020. PMID: 31915854 Free PMC article. Review.
-
Cancer Immune Therapy for Philadelphia Chromosome-Negative Chronic Myeloproliferative Neoplasms.Cancers (Basel). 2020 Jul 2;12(7):1763. doi: 10.3390/cancers12071763. Cancers (Basel). 2020. PMID: 32630667 Free PMC article. Review.
Cited by
-
Allogeneic hematopoietic cell transplantation in patients with CALR-mutated myelofibrosis: a study of the Chronic Malignancies Working Party of EBMT.Bone Marrow Transplant. 2023 Dec;58(12):1357-1367. doi: 10.1038/s41409-023-02094-1. Epub 2023 Sep 7. Bone Marrow Transplant. 2023. PMID: 37679647
-
Revisiting Circulating Extracellular Matrix Fragments as Disease Markers in Myelofibrosis and Related Neoplasms.Cancers (Basel). 2023 Aug 29;15(17):4323. doi: 10.3390/cancers15174323. Cancers (Basel). 2023. PMID: 37686599 Free PMC article. Review.
-
Case Report: First longitudinal study of a patient with CALR positive clonal hematopoiesis of indeterminate potential developing into pre-fibrotic myelofibrosis.Front Oncol. 2023 May 8;13:1176173. doi: 10.3389/fonc.2023.1176173. eCollection 2023. Front Oncol. 2023. PMID: 37223675 Free PMC article.
-
Calreticulin mutant myeloproliferative neoplasms induce MHC-I skewing, which can be overcome by an optimized peptide cancer vaccine.Sci Transl Med. 2022 Jun 15;14(649):eaba4380. doi: 10.1126/scitranslmed.aba4380. Epub 2022 Jun 15. Sci Transl Med. 2022. PMID: 35704596 Free PMC article.
-
SOHO State of the Art Updates and Next Questions: Novel Therapeutic Strategies in Development for Myelofibrosis.Clin Lymphoma Myeloma Leuk. 2023 Apr;23(4):219-231. doi: 10.1016/j.clml.2022.12.014. Epub 2023 Jan 6. Clin Lymphoma Myeloma Leuk. 2023. PMID: 36797153 Free PMC article. Review.
References
-
- Mesa RA, Silverstein MN, Jacobsen SJ, Wollan PC, Tefferi A. Population-based incidence and survival figures in essential thrombocythemia and agnogenic myeloid metaplasia: An olmsted county study, 1976-1995. Am J Hematol (1999) 61:10–5. 10.1002/(SICI)1096-8652(199905)61:1<10::AID-AJH3>3.0.CO;2-I - DOI - PubMed
Associated data
LinkOut - more resources
Full Text Sources
Other Literature Sources
Medical
Molecular Biology Databases
Research Materials
Miscellaneous

