Review
. 2021 Feb 25:11:638327.
doi: 10.3389/fonc.2021.638327. eCollection 2021.

Near-Infrared Fluorescence Imaging and Photodynamic Therapy for Liver Tumors

Affiliations
Review

Near-Infrared Fluorescence Imaging and Photodynamic Therapy for Liver Tumors

Masaki Kaibori et al. Front Oncol. .

Abstract

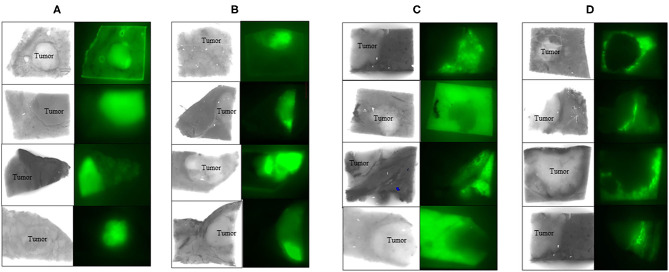
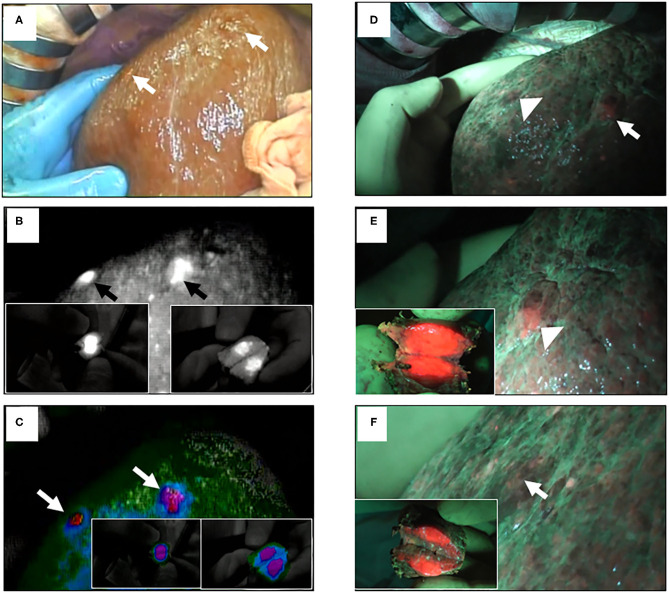
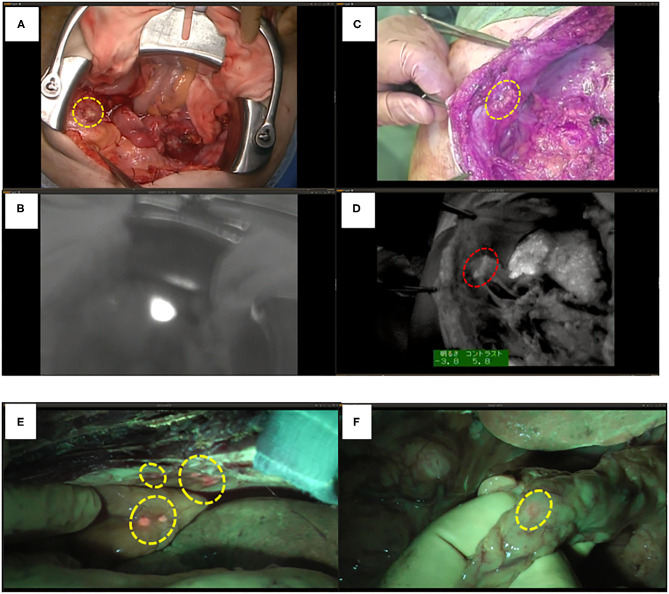
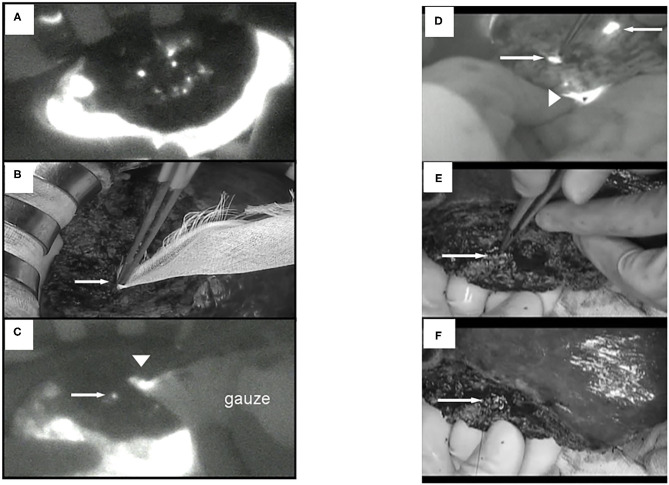
Surgery with fluorescence equipment has improved to treat the malignant viscera, including hepatobiliary and pancreatic neoplasms. In both open and minimally invasive surgeries, optical imaging using near-infrared (NIR) fluorescence is used to assess anatomy and function in real time. Here, we review a variety of publications related to clinical applications of NIR fluorescence imaging in liver surgery. We have developed a novel nanoparticle (indocyanine green lactosome) that is biocompatible and can be used for imaging cancer tissues and also as a drug delivery system. To date, stable particles are formed in blood and have an ~10-20 h half-life. Particles labeled with a NIR fluorescent agent have been applied to cancer tissues by the enhanced permeability and retention effect in animals. Furthermore, this article reviews recent developments in photodynamic therapy with NIR fluorescence imaging, which may contribute and accelerate the innovative treatments for liver tumors.

Keywords: indocyanine green lactosome; liver surgery navigation; liver tumors; near-infrared fluorescence imaging; photodynamic therapy.


Conflict of interest statement

The authors declare that the research was conducted in the absence of any commercial or financial relationships that could be construed as a potential conflict of interest.

Figures

Figure 1
Figure 1
ICG fluorescence image in cancerous liver tissue. Whole (A) and partial (B) fluorescence image (FI) in cancer. Whole (C) and ring (D) FI in the surrounding non-cancerous liver tissue. ICG FI in resected liver specimens could confirm HCC. FI; filter excitation: 785 nm, emission: 845 nm, using Clairvivo OPT, Shimadzu, Kyoto, Japan.
Figure 2
Figure 2
ICG and 5-ALA fluorescence images of superficial malignant liver tumors. (A) Two superficial malignant liver tumors with serosa (arrows); conventional white light. (B) ICG FI of the same tumors (arrows); insets show the incised lesions. (C) ICG FI of the same tumors using color mode (arrows). (D) The same tumors (arrowhead and arrow); blue light. (E) 5-ALA FI of the same tumors (arrowhead); inset shows the incised lesion. (F) 5-ALA FI of the other tumor (arrow); inset shows incised lesion.
Figure 3
Figure 3
ICG and 5-ALA fluorescence images of metastases through HCC. (A) Ovarian and peritoneal metastases (yellow circle); conventional white light. (B) ICG FI of peritoneal metastasis. (C) Peritoneal metastasis (yellow circle); conventional white light. (D) ICG FI of peritoneal metastasis (red circle). (E) 5-ALA FI of peritoneal and colon metastases of intrahepatic cholangiocellular carcinoma (yellow circles). (F) 5-ALA FI of omental metastasis (yellow circle).
Figure 4
Figure 4
ICG fluorescent images by the photodynamic eye system. (A) White spots (possible bile leakages) on cut liver surface. (B) Minor leak from duct is compressed with gauze, which is not visible to the surgeons (arrow). (C) ICG FI after gauze application reveals minor leakage on the cut liver surface (arrow); fluorescence is also detected through the gauze (arrowhead). (D) FI identified two fluorescing ducts on the cut liver surface (arrows). The upper bile duct is intact (upper arrow). Arrowhead: common bile duct. (E) The lower fluorescing lesion corresponds to a partly closed bile duct stump (arrow). (F) The bile duct stump was repaired (arrow, z-sutures using 6-0 non-absorbable thread).
Figure 5
Figure 5
In vitro PDT on cell viability and morphological changes in ICG lactosome-treated HuH-7 cells. Cells were divided into four groups: control, ICG-L, laser, and PDT (ICG-L + laser). The laser and PDT groups were irradiated with (A) 18 J/cm2 (190 mW/cm2 and 95 s), (B) 18 J/cm2 (340 mW/cm2 and 55 s), (C) 100 J/cm2 (190 mW/cm2 and 525 s), and (D) 100 J/cm2 (340 mW/cm2 and 300 s). Cell viability (OD570) was measured by the MTT assay (n = 4 /time/group; *P < 0.001 for ICG-L vs. other groups). Morphological changes (phase-contrast microscope at 96 h). (E) Control, (F) ICG-L, (G) laser [100 J/cm2 (340 mW/cm2 and 300 s)], and (H) PDT (ICG-L + laser). https://doi.org/10.1371/journal.pone.0183527.g001.g002.
Figure 6
Figure 6
In vivo fluorescence imaging in ICG lactosome-treated mice with subcutaneous tumors. After injection of ICG (A,C) or ICG-L (B,D) in mice, the brightness of the tumor (open circles) and non-tumor (contralateral inguinal, closed circles) areas was measured (IVIS system). P < 0.001 between the tumor and non-tumor regions in the ICG-L group; n = 5/group. (E) Effect of laser irradiation on tumor temperature. At 48 h after ICG (yellow), ICG-L (brown) or no injection (control, dark) in the tumor implanted-mice, laser irradiation (500 mW/cm2 and 200 s, 100 J/cm2) was initiated, and the temperatures were measured (P < 0.001 for ICG vs. ICG-L; n = 6/group). https://doi.org/10.1371/journal.pone.0183527.g004,g006.
Figure 7
Figure 7
In vivo PDT on tumor growth in ICG lactosome-treated mice with subcutaneous tumors. (A) At 48 h after ICG (open circles) or ICG-L (closed circles) injection in mice, laser irradiation (500 mW/cm2 and 200 s, 100 J/cm2) was carried out, and tumor volumes were measured. (P < 0.001 for ICG vs. ICG-L; n = 6/group.) (B–D) Effect of PDT on apoptosis of tumors. Tumors were resected at 24 h after irradiation (500 mW/cm2 and 200 s, 100 J/cm2) in the ICG (B) and ICG-L (C) groups and examined for apoptosis (TUNEL staining). (D) Apoptotic indexes in the ICG-treated and ICG L-treated groups (P = 0.001 for ICG vs. ICG-L; n = 5/group.) https://doi.org/10.1371/journal.pone.0183527.g005,g007.

Similar articles

Cited by

References

    1. Rubens FD, Ruel M, Fremes SE. A new and simplified method for coronary and graft imaging during CABG. Heart Surg Forum. (2002) 5:141–4. - PubMed
    1. Taggart DP, Choudhary B, Anastasiadis K, Abu-Omar Y, Balacumaraswani L, Pigott DW. Preliminary experience with a novel intraoperative fluorescence imaging technique to evaluate the patency of bypass grafts in total arterial revascularization. Ann Thorac Surg. (2003) 75:870–3. 10.1016/S0003-4975(02)04669-6 - DOI - PubMed
    1. Reuthebuch O, Haussler A, Genoni M, Tavakoli R, Odavic D, Kadner A, et al. . Intraoperative quality assessment in off-pump coronary artery bypass grafting. Chest. (2004) 125:418–24. 10.1378/chest.125.2.418 - DOI - PubMed
    1. Balacumaraswani L, Abu-Omar Y, Choudhary B, Pigott D, Taggart DP. A comparison of transit-time flowmetry and intraoperative fluorescence imaging for assessing coronary artery bypass graft patency. J Thorac Cardiovasc Surg. (2005) 130:315–20. 10.1016/j.jtcvs.2004.11.033 - DOI - PubMed
    1. Mitsuhashi N, Kimura F, Shimizu H, Imamaki M, Yoshidome H, Ohtsuka M, et al. . Usefulness of intraoperative fluorescence imaging to evaluate local anatomy in hepatobiliary surgery. J Hepatobiliary Pancreat Surg. (2008) 15:508–14. 10.1007/s00534-007-1307-5 - DOI - PubMed

LinkOut - more resources