. 2021 Feb 26:9:604899.
doi: 10.3389/fped.2021.604899. eCollection 2021.

Gestational Age-Specific Complete Blood Count Signatures in Necrotizing Enterocolitis

Affiliations

Gestational Age-Specific Complete Blood Count Signatures in Necrotizing Enterocolitis

Julia M Pantalone et al. Front Pediatr. .

Abstract

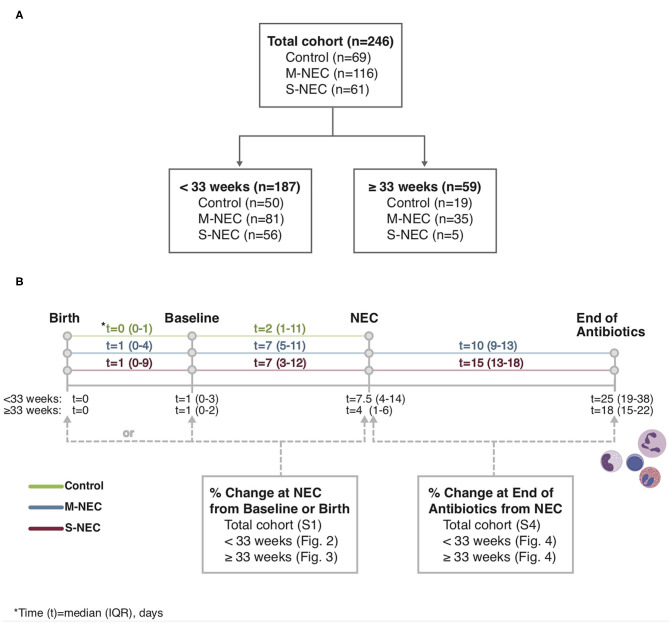
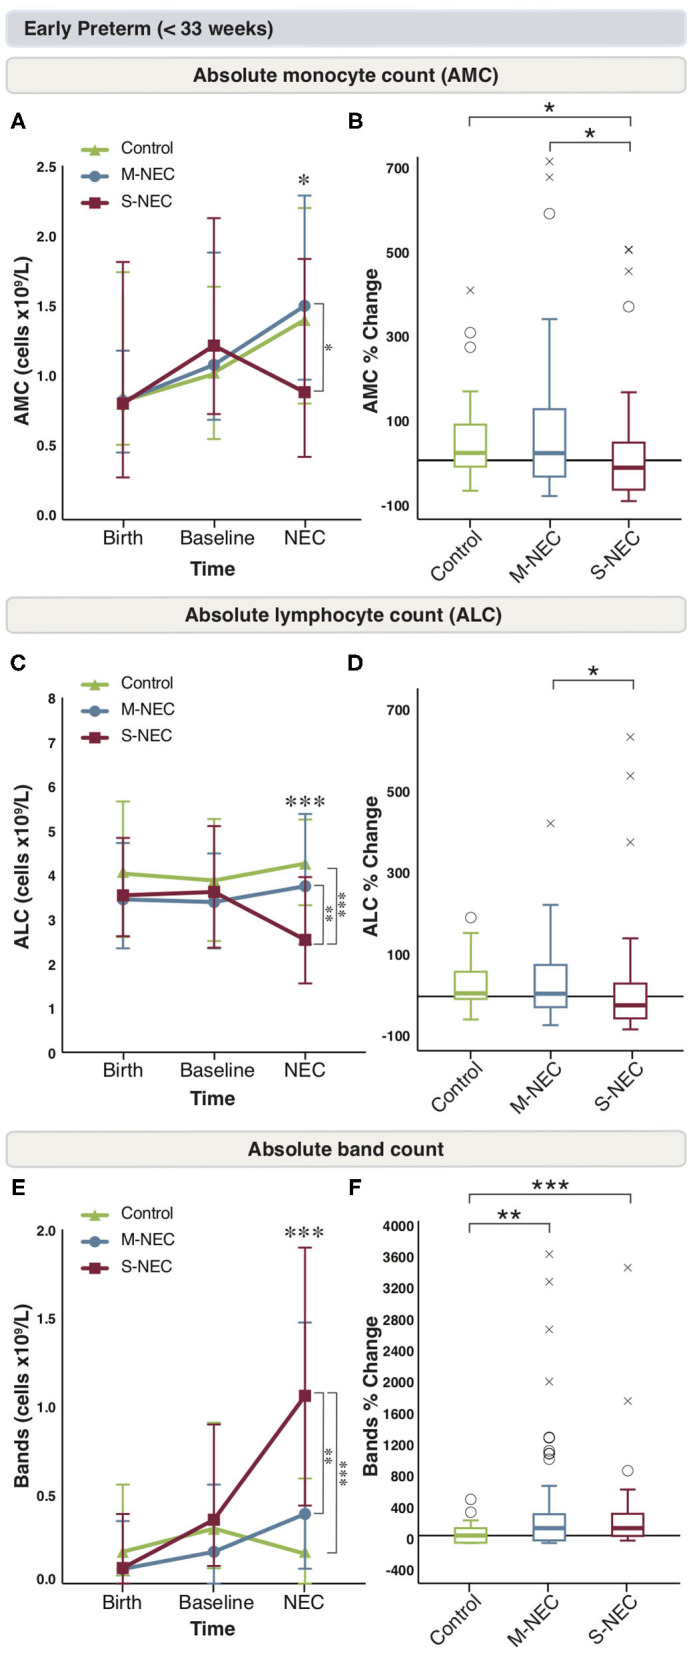
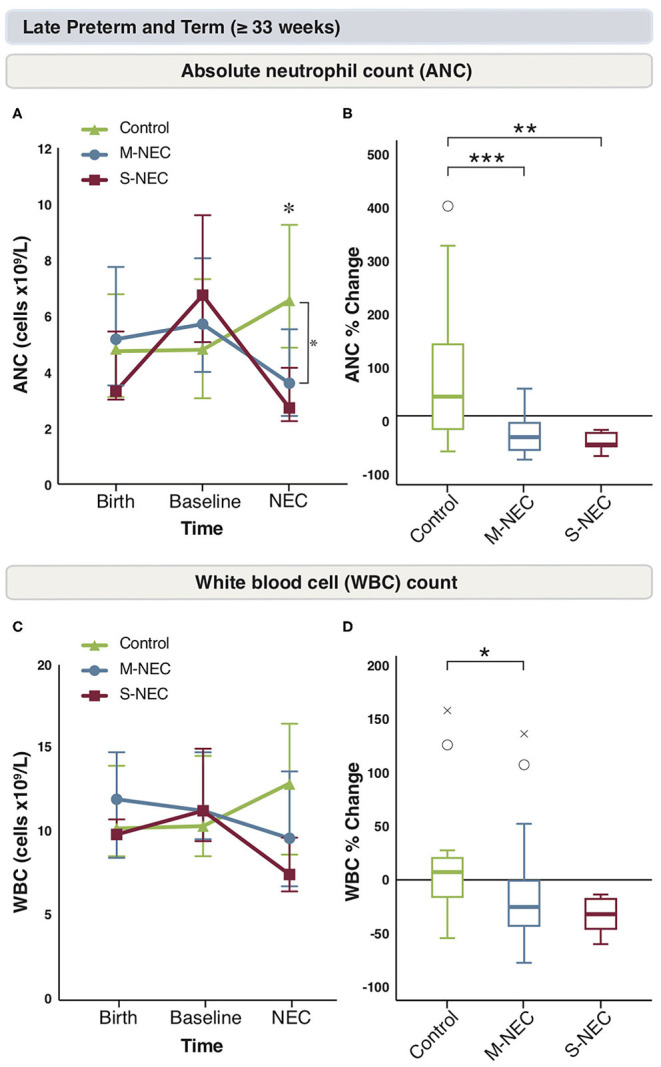
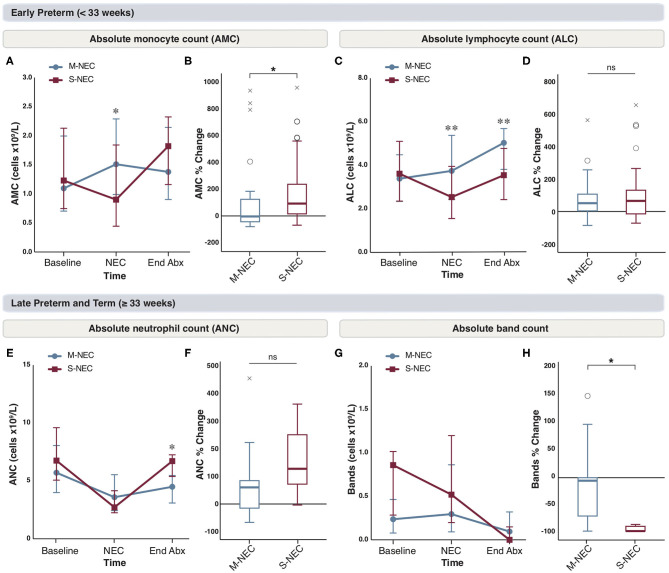
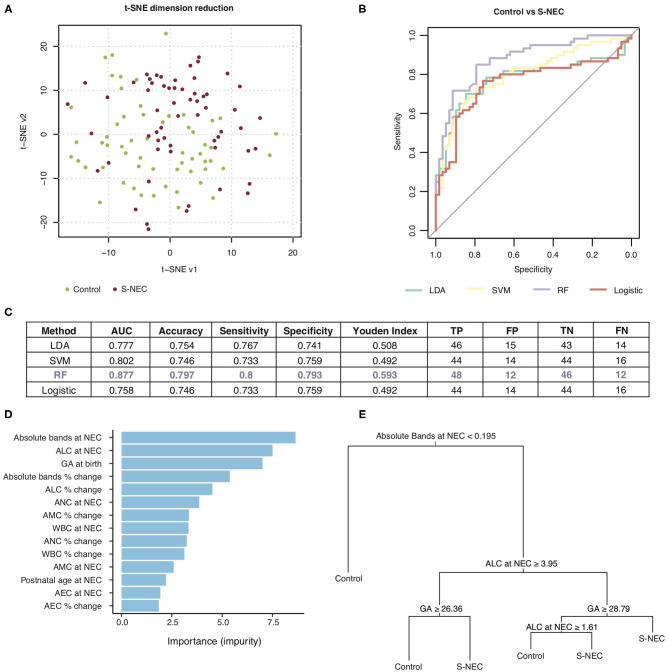
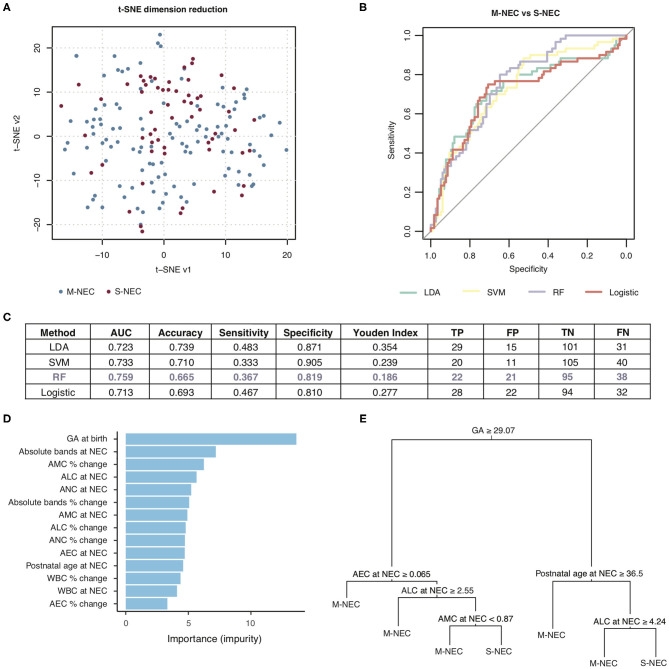
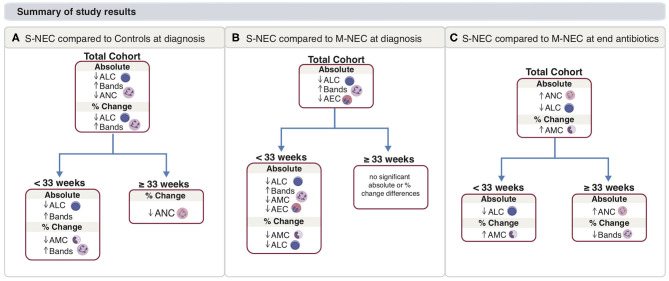
Objective: Necrotizing enterocolitis (NEC) is characterized by peripheral cell abnormalities, yet few studies have analyzed the complete blood count (CBC) specifically by gestational age (GA). Our objective was to describe GA-specific immune abnormalities in NEC through a comprehensive analysis of the CBC differential. Methods: Using a cohort of 246 infants (177 cases, 69 controls) admitted to neonatal intensive care units at a single institution, we retrospectively analyzed CBCs around illness onset in NEC cases compared with controls. Cases included surgical NEC (S-NEC, 34.5%) and medical NEC (M-NEC, 65.5%). Infants were divided into those born at GA <33 and ≥33 weeks. Differences in CBC values were described as absolute and percent changes at NEC onset from baseline and at antibiotic completion after NEC. We used machine learning algorithms based on the CBC at NEC to generate predictive models for diagnosis. Results: At NEC onset, there was an acute drop in monocytes and lymphocytes along with a rise in bands in S-NEC infants born <33 weeks compared with M-NEC. In comparison, both M-NEC and S-NEC ≥33 weeks had a percent drop in neutrophils at diagnosis compared with controls. At antibiotic completion, monocytes in S-NEC <33 weeks significantly rose compared with M-NEC, yet for S-NEC ≥33 weeks, bands significantly dropped compared with M-NEC. Predictive modeling was able to accurately predict S-NEC from M-NEC and controls. Conclusion: There are discrete leukocyte patterns in NEC based on GA. The CBC at diagnosis may be useful in identifying patients who will require surgery.

Keywords: complete blood count; gestational age; immunology; necrotizing entercolitis; pre-maturity.


Conflict of interest statement

The authors declare that the research was conducted in the absence of any commercial or financial relationships that could be construed as a potential conflict of interest.

Figures

Figure 1
Figure 1
Study flowchart (A) and timeline (B). Complete blood count (CBC) values obtained at birth, baseline, necrotizing enterocolitis (NEC) diagnosis, and the end of the antibiotic course were recorded from the electronic medical record.
Figure 2
Figure 2
Changes in peripheral cell counts for infants <33 weeks. Median absolute levels of monocytes (A), lymphocytes (C), and bands (E) are plotted at birth, baseline, and NEC diagnosis. Tukey boxplots for percent changes in monocytes (B), lymphocytes (D), and bands (F) at NEC diagnosis compared with baseline. Bars represent 25 and 75% percentiles (A,C,E) or 1.5×the interquartile ranges (IQR) (B,D,F). *Significance for absolute cell count; *p < 0.05, **p < 0.01, ***p < 0.001. *Significance for percent change; *p < 0.05, **p < 0.01, ***p < 0.001. °Indicates outliers (>1.5 × IQR) and xindicates extreme outliers (>3 × IQR).
Figure 3
Figure 3
Changes in peripheral cell counts for infants ≥33 weeks. Median absolute levels of neutrophils (A) and WBC count (C) are plotted at birth, baseline, and NEC diagnosis. Tukey boxplots for percent changes in neutrophils (B) and WBC count (D) at NEC diagnosis compared with baseline. Bars represent 25 and 75% percentiles (A,C) or 1.5× the IQR (B,D). *Significance for absolute cell count; *p < 0.05. *Significance for percent change; *p < 0.05, **p < 0.01, ***p < 0.001. °Indicates outliers (>1.5 × IQR) and xindicates extreme outliers (>3 × IQR).
Figure 4
Figure 4
Changes in peripheral cell counts in infants <33 weeks (A–D) and ≥33 weeks (E–H) at the end of antibiotic treatment. Median absolute levels of monocytes (A), lymphocytes (C), neutrophils (E), and bands (G) are plotted at baseline, NEC diagnosis, and the end of the antibiotic course (End Abx). Tukey boxplots for percent changes in monocytes (B), lymphocytes (D), neutrophils (F), and bands (H) at end of antibiotics compared with NEC diagnosis. Bars represent 25 and 75% percentiles (A,C,E,G) or 1.5× the IQR (B,D,F,H). *Significance for absolute cell count; *p < 0.05, **p < 0.01. *Significance for percent change; *p < 0.05. °Indicates outliers (>1.5 × IQR) and xindicates extreme outliers (>3 × IQR).
Figure 5
Figure 5
Machine learning prediction model for two-way comparison of surgical NEC (S-NEC) and controls. (A) t-SNE separation of S-NEC and controls. (B) Receiver-operating characteristic curve for models using LDA, SVM, RF, and logistic regression. (C) Table of model characteristics. (D) Contribution of each CBC component to the model. (E) Representative decision tree. AUC, area under the curve; TP, true positive; FP, false positive; TN, true negative; FN, false negative.
Figure 6
Figure 6
Machine learning prediction model for two-way comparison of S-NEC and medical NEC (M-NEC). (A) t-SNE separation of S-NEC and M-NEC. (B) Receiver operating characteristic curve for models using LDA, SVM, RF, and logistic regression. (C) Table of model characteristics. (D) Contribution of each CBC component to the model. (E) Representative decision tree. AUC, area under the curve; TP, true positive; FP, false positive; TN, true negative; FN, false negative.
Figure 7
Figure 7
Main study results. Summary for S-NEC compared with controls (A) and M-NEC (B) for absolute and percent change differences at NEC diagnosis from baseline. (C) Summary for S-NEC compared with M-NEC for absolute and percent change differences at the end of antibiotics compared with NEC diagnosis.

Similar articles

Cited by

References

    1. Patel RM, Kandefer S, Walsh MC, Bell EF, Carlo WA, Laptook AR, et al. . Causes and timing of death in extremely premature infants from 2000 through 2011. N Engl J Med. (2015) 372:331–40. 10.1056/NEJMoa1403489 - DOI - PMC - PubMed
    1. Wertheimer F, Arcinue R, Niklas V. Necrotizing enterocolitis: enhancing awareness for the general practitioner. Pediatr Rev. (2019) 40:517–27. 10.1542/pir.2017-0338 - DOI - PubMed
    1. Gordon P, Christensen R, Weitkamp J-H, Maheshwari A. Mapping the new world of necrotizing enterocolitis (NEC): review and opinion. EJ Neonatol Res. (2012) 2:145–72. - PMC - PubMed
    1. Remon J, Kampanatkosol R, Kaul RR, Muraskas JK, Christensen RD, Maheshwari A. Acute drop in blood monocyte count differentiates NEC from other causes of feeding intolerance. J Perinatol. (2014) 34:549–54. 10.1038/jp.2014.52 - DOI - PMC - PubMed
    1. Desiraju S, Bensadoun J, Bateman D, Kashyap S. The role of absolute monocyte counts in predicting severity of necrotizing enterocolitis. J Perinatol. (2020) 40:922–7. 10.1038/s41372-020-0596-2 - DOI - PMC - PubMed

LinkOut - more resources